
A Startling View of How Much Carbon We Emit in a Year
ENVIRONMENT, 24 Nov 2014
Kevin Loria – Business Insider
Every year we pump more and more carbon dioxide into the atmosphere, mostly by burning fossil fuels.
The ocean has absorbed a lot of this greenhouse gas in recent years but it’s losing its ability to do so and atmospheric gas levels continue to grow, leading us closer to a point where significant global warming will be inevitable.
This spring, levels of atmospheric CO2 topped 400 parts per million in most of the northern hemisphere for the first time in modern human history — experts think we need to lower those levels to be consistently below 350 ppm to avoid the worst effects of climate change.
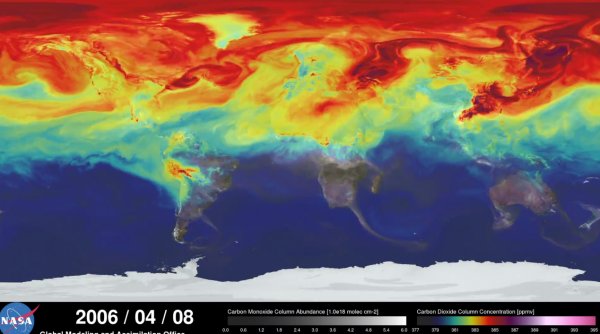
The NASA Goddard Space Flight Center recently created the high-resolution computer model below from data gathered between May 2005 and June 2007, which they use to illustrate how carbon in the atmosphere changed throughout 2006. It shows the greenhouse gases produced by humans and naturally from the Earth and then spread around the atmosphere by the wind. The model shows one year of data in just a few minutes.
As you can see, most carbon dioxide comes from industrialized parts of North America, Europe, and Asia. There, it’s picked up by winds and spreads around the globe, especially in the Northern hemisphere.
These gases are considered particularly responsible for warming in the Arctic, located above Europe and North America, where these greenhouse gasses are pooling, and where temperatures are rising twice as quickly as in the rest of the world. This has led to record lows in Arctic sea ice, considered a harbinger for the rest of the world — and despite what some may think, this Arctic melting is not offset by sea ice in Antarctica.
About half of the gas spewed into the atmosphere is absorbed by the ocean and land, especially by plants and trees which suck in high levels of carbon in the spring and summer while they grow — though deforestation has a significant negative effect on the amount of carbon that can be absorbed.
While these activities temporarily drop the levels of atmospheric CO2, much is still absorbed into the oceans. This carbon has devastating effects on the ocean, especially by increasing its acidification, which puts a good portion of marine life at risk.
Along with CO2, the model also shows carbon monoxide levels, shown in darker shades of color. This powerful greenhouse gas is mostly produced by fires in the Southern hemisphere, before it too is picked up by winds that take it around the planet.
NASA was able to use a supercomputer along with ground measurements and atmospheric data to create this visualization, but in the future they’ll have even more information from the Orbiting Carbon Observatory-2 satellite, which launched in July [2014].
Check out the full visualization video below.
httpv://www.youtube.com/watch?v=x1SgmFa0r04&feature=youtu.be
________________________________
SEE ALSO:
25 Devastating Effects Of Climate Change
These 10 Charts Will Show You The Dangers Of Climate Change
These Last 6 Months Were The Warmest Humans Have Ever Recorded On Earth
Kevin writes about health and science for Business Insider. He graduated from the CUNY Graduate School of Journalism in 2012, where he focused on health and science writing, and got a B.A. in political science and philosophy from the University of Notre Dame. He’s written for Condé Nast Traveler, The Christian Science Monitor, and other publications.
Go to Original – businessinsider.com
DISCLAIMER: The statements, views and opinions expressed in pieces republished here are solely those of the authors and do not necessarily represent those of TMS. In accordance with title 17 U.S.C. section 107, this material is distributed without profit to those who have expressed a prior interest in receiving the included information for research and educational purposes. TMS has no affiliation whatsoever with the originator of this article nor is TMS endorsed or sponsored by the originator. “GO TO ORIGINAL” links are provided as a convenience to our readers and allow for verification of authenticity. However, as originating pages are often updated by their originating host sites, the versions posted may not match the versions our readers view when clicking the “GO TO ORIGINAL” links. This site contains copyrighted material the use of which has not always been specifically authorized by the copyright owner. We are making such material available in our efforts to advance understanding of environmental, political, human rights, economic, democracy, scientific, and social justice issues, etc. We believe this constitutes a ‘fair use’ of any such copyrighted material as provided for in section 107 of the US Copyright Law. In accordance with Title 17 U.S.C. Section 107, the material on this site is distributed without profit to those who have expressed a prior interest in receiving the included information for research and educational purposes. For more information go to: http://www.law.cornell.edu/uscode/17/107.shtml. If you wish to use copyrighted material from this site for purposes of your own that go beyond ‘fair use’, you must obtain permission from the copyright owner.