
Ecological Footprint by Country 2023
ENVIRONMENT, 30 Jan 2023
World Population Review - TRANSCEND Media Service
Ecological Footprint
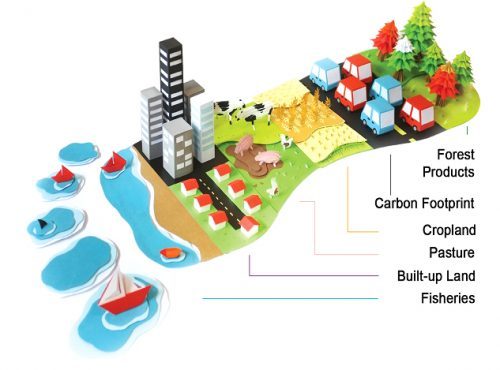
What is an ecological footprint?
Ecological footprint is a metric computed by the Global Footprint Network and used to determine the impact humans are having on the environment in a given place or country. Ecological footprint measures the natural resources humans are consuming in the environment through activities such as forestry, farming, fishing, mining, and manufacturing. Especially when considered alongside complementary metrics such as biocapacity, ecological footprint can help individuals understand their impact on the planet; guide countries in improving sustainability and well-being, and inform local leaders allocating funding for public projects.
Ecological footprint is typically used alongside another metric, biocapacity, to establish a supply-and-demand-based environmental accounting system. The supply of natural resources (biocapacity) is compared to the demand for those resources (the footprint) to determine if the environment is capable of sustaining current levels of resource consumption. As a rule, both ecological footprint and biocapacity are expressed in “per capita” values using global hectares (gha) as the unit.
Top 10 Countries with the Highest Ecological Footprint (in gha, 2017)
- Qatar — 14.72
- Luxembourg — 12.79
- United Arab Emirates — 8.95
- Bahrain — 8.66
- Trinidad and Tobago — 8.23
- Canada — 8.08
- Mongolia — 8.05
- United States — 8.04
- Kuwait — 8.03
- Oman — 7.29
Ecological footprint, biocapacity, and biocapacity reserve
In terms of supply and demand, ecological footprint covers only the demand side of the equation, measuring the ecological assets a population needs to produce the natural resources it consumes and to absorb its carbon emissions and other waste. In order to gauge the true impact of a country’s ecological footprint, it must be compared to a parallel metric, biocapacity, which covers the supply side of the equation. Biocapacity measures the capacity of a given area to generate renewable resources and to absorb any wastes generated by their consumption—in other words, its ability to support a human population.
If a given population’s ecological footprint exceeds its biocapacity, that population has an ecological deficit. This means that the population’s demand for natural resources exceeds its supply, which can lead to resource shortages (including basics such as food and shelter), higher prices, and elevated levels of pollution in the air, water, and soil. Conversely, if a given population’s biocapacity exceeds its ecological footprint, it has an ecological reserve, which means it can support the existing population at its current level of consumption with few worries. Therefore, maintaining an ecological footprint that is smaller than biocapacity is a necessary condition for the sustainability of humanity.
Ecological footprint is often subtracted from biocapacity to determine an environment’s “biocapacity reserve,” which displays the supply/demand comparison as a single number. A positive biocapacity reserve means the environment is producing or replenishing resources faster than humans are currently consuming them. A negative reserve means that humans are using the resources faster than the environment can replenish them.
Ecological footprints, biocapacities, and biocapacity reserves vary greatly between countries. A country’s footprint and biocapacity depend on several factors including its geography, population size, environmental policies, and level of development. Highly developed and high-income countries tend to have higher ecological footprints than low-income or least developed countries, which often have less industry and smaller populations. That said, many developing countries burn vast amounts of fossil fuel, which is often the primary contributor to ecological footprint. Smaller land area (which decreases biocapacity) and high populations (which increase consumption) can also be a factor. Also, it is possible for highly developed countries to achieve a positive biocapacity reserve, as shown by the presence of both Canada and Finland in the top 10 listed below. Additional eco-friendly countries include Denmark and Switzerland.
Top 10 Countries with the Highest Biocapacity Reserve (in gha, 2017)
- Suriname — 80.87
- Guyana — 63.98
- Gabon — 19.28
- Bolivia — 12.41
- Congo (Rep. of) — 7.87
- Canada — 6.90
- Paraguay — 6.74
- Finland — 6.61
- Central African Republic — 6.35
- Brazil — 5.80
The world-average ecological footprint was 2.77 global hectares per person (12 billion total) in 2017, with an average biocapacity of 1.60 global hectares. This computes to a global deficit of 1.17 global hectares per person, or a biocapacity reserve of -1.17, meaning humanity’s consumption of natural resources is currently outpacing the Earth’s ability to replenish those resources.
5 countries with the highest total ecological deficits (in gha)
1. China
China had an ecological footprint of 3.71 hectares per capita and a biocapacity of 0.92 per capita in 2017. China’s total ecological footprint is 5.3 billion gha, the highest of any country in the world. China boasts a biocapacity of 1.3 billion hectares, the second-largest in the world (behind Brazil) but also has more people than any other country, which ultimately results in a total ecological deficit of -4 billion gha and a per-capita biocapacity reserve of -2.79—both quite high for a country with such impressive biocapacity. As China’s economy continues to rapidly expand, its citizens’ incomes—and their consumption of resources—are rising as well. This unbalanced consumption of resources will likely be one of China’s main concerns for the future.
2. United States
The U.S. has an ecological footprint of 8.04 gha per capita, one of the highest in the world, with a biocapacity per capita of only 3.45 hectares. This leads to a total ecological deficit of -1.49 billion hectares, a biocapacity reserve of -4.59 gha per capita. The average US citizen’s ecological footprint is about 50% larger than that of the average person in most European countries. The U.S. has more suburban sprawl and less public transportation than most countries, which burns more fossil fuels and adds to its per-capita carbon usage. The U.S. population also uses more energy and water per person than most other comparable, developed countries. California, for example, has approximately the same ecological footprint (and GDP) as France, despite having roughly 60% as many people (39.5 million vs 65.3 million).
3. India
India’s ecological footprint per capita is a modest 1.19, which is arguably a reflection of a negative quality: the country’s widespread poverty, in which many people cannot afford to own a car or heat their homes. India’s biocapacity per capita is also low, 0.43 hectares, likely a symptom of the country’s smaller land area compared to the U.S. and China. India’s biocapacity reserve of -0.76 ranks fairly well among other countries—however, because India also has the world’s second-largest population, its total ecological deficit still reaches more than -1 billion hectares.
4 & 5. Japan and South Korea
Japan’s ecological footprint is 4.65 hectares per capita and its biocapacity is 0.59 hectares per capita. Japan’s ecological deficit is -517 million gha, the fourth-highest in the world. As with many countries, the majority of Japan’s ecological footprint comes from its burning of fossil fuels. However, Japan’s biocapacity is additionally stressed by small land area, which decreases production, combined with a comparatively large population and a high level of advancement, both of which boost consumption. The world’s fifth-largest ecological deficit (-281 billion gha) belongs to South Korea, whose scenario—high carbon use, low biocapacity, dense population, and high advancement—mirrors that of Japan.
Eco-footprint success story: the United Kingdom
However, it is notable that the United Kingdom, which had the fifth-largest ecological deficit just a few years ago, has dropped to ninth place and is on track to keep falling. Between 2007 and 2017, the United Kingdom’s ecological footprint dropped nearly 27%, due mostly to reductions in fossil fuel use, which trimmed the country’s overall ecological deficit from -307.9 billion gha in 2007 to -206.2 gha in 2017.
| Biocapacity (per capita) | 2023 Population | ||
|---|---|---|---|
| Qatar | 14.72 | 0.97 | 2,716,391 |
| Luxembourg | 12.79 | 1.21 | 654,768 |
| United Arab Emirates | 8.95 | 0.53 | 9,516,871 |
| Bahrain | 8.66 | 0.48 | 1,485,509 |
| Trinidad And Tobago | 8.23 | 1.54 | 1,534,937 |
| Canada | 8.08 | 14.98 | 38,781,291 |
| Mongolia | 8.05 | 13.76 | 3,447,157 |
| United States | 8.04 | 3.45 | 339,996,563 |
| Kuwait | 8.03 | 0.00 | 4,310,108 |
| Bermuda | 8.00 | 0.14 | 64,069 |
| Cook Islands | 7.34 | 1.41 | 17,044 |
| Oman | 7.29 | 1.46 | 4,644,384 |
| Australia | 7.27 | 12.64 | 26,439,111 |
| Estonia | 7.16 | 9.74 | 1,322,765 |
| Denmark | 6.93 | 4.22 | 5,910,913 |
| Aruba | 6.64 | 0.56 | 106,277 |
| Belgium | 6.60 | 0.82 | 11,686,140 |
| Latvia | 6.13 | 0.48 | 1,830,211 |
| Sweden | 6.08 | 9.43 | 10,612,086 |
| Austria | 6.02 | 2.73 | 8,958,960 |
| Brunei | 6.00 | 2.75 | 452,524 |
| Kazakhstan | 5.99 | 3.55 | 19,606,633 |
| Belize | 5.99 | 3.76 | 410,825 |
| Singapore | 5.87 | 0.06 | 6,014,723 |
| Lithuania | 5.86 | 5.14 | 2,718,352 |
| Cayman Islands | 5.86 | 0.30 | 69,310 |
| Finland | 5.84 | 12.45 | 5,545,475 |
| Norway | 5.78 | 7.15 | 5,474,360 |
| Saudi Arabia | 5.77 | 0.42 | 36,947,025 |
| Malta | 5.68 | 0.58 | 535,064 |
| Israel | 5.55 | 0.22 | 9,174,520 |
| Russia | 5.48 | 6.96 | 144,444,359 |
| Czech Republic | 5.47 | 2.36 | 10,495,295 |
| Turkmenistan | 5.22 | 2.36 | 6,516,100 |
| Netherlands | 5.02 | 0.81 | 17,618,299 |
| Ireland | 5.01 | 3.34 | 5,056,935 |
| Slovenia | 4.90 | 2.18 | 2,119,675 |
| Poland | 4.71 | 1.97 | 41,026,067 |
| Germany | 4.70 | 1.54 | 83,294,633 |
| Japan | 4.65 | 0.59 | 123,294,513 |
| France | 4.60 | 2.53 | 64,756,584 |
| Switzerland | 4.47 | 1.02 | 8,796,669 |
| Montserrat | 4.45 | 1.33 | 4,386 |
| Italy | 4.41 | 0.88 | 58,870,762 |
| Slovakia | 4.41 | 2.69 | 5,795,199 |
| Portugal | 4.40 | 1.28 | 10,247,605 |
| Bhutan | 4.37 | 4.90 | 787,424 |
| New Zealand | 4.32 | 9.16 | 5,228,100 |
| Martinique | 4.31 | 0.39 | 366,981 |
| Chile | 4.28 | 3.41 | 19,629,590 |
| Antigua And Barbuda | 4.27 | 0.83 | 94,298 |
| United Kingdom | 4.20 | 1.08 | 67,736,802 |
| Belarus | 4.20 | 3.09 | 9,498,238 |
| Greece | 4.12 | 1.39 | 10,341,277 |
| Montenegro | 4.09 | 3.01 | 626,485 |
| Guadeloupe | 4.05 | 0.46 | 395,839 |
| Spain | 4.03 | 1.20 | 47,519,628 |
| Malaysia | 3.91 | 2.29 | 34,308,525 |
| Cyprus | 3.88 | 0.24 | 1,260,138 |
| French Polynesia | 3.84 | 1.34 | 308,872 |
| Barbados | 3.73 | 0.17 | 281,995 |
| Croatia | 3.72 | 2.99 | 4,008,617 |
| China | 3.71 | 0.92 | 1,425,671,352 |
| Hungary | 3.67 | 2.51 | 10,156,239 |
| Bulgaria | 3.64 | 3.30 | 6,687,717 |
| Bahamas | 3.63 | 9.06 | 412,623 |
| Turkey | 3.51 | 1.40 | 85,816,199 |
| Bosnia And Herzegovina | 3.49 | 1.77 | 3,210,847 |
| Libya | 3.46 | 0.65 | 6,888,388 |
| British Virgin Islands | 3.43 | 1.86 | 31,538 |
| Romania | 3.40 | 3.09 | 19,892,812 |
| Lebanon | 3.33 | 0.26 | 5,353,930 |
| Argentina | 3.30 | 6.58 | 45,773,884 |
| Tonga | 3.24 | 1.60 | 107,773 |
| South Africa | 3.16 | 1.03 | 60,414,495 |
| Paraguay | 3.09 | 9.83 | 6,861,524 |
| Bolivia | 3.08 | 15.49 | 12,388,571 |
| Guyana | 3.07 | 67.05 | 813,834 |
| Mauritius | 3.06 | 0.70 | 1,300,557 |
| Brazil | 2.81 | 8.61 | 216,422,446 |
| Fiji | 2.81 | 2.16 | 936,375 |
| Suriname | 2.76 | 83.63 | 623,236 |
| Grenada | 2.76 | 1.98 | 126,183 |
| Serbia | 2.75 | 1.34 | 7,149,077 |
| Botswana | 2.74 | 3.02 | 2,675,352 |
| Ukraine | 2.66 | 2.58 | 36,744,634 |
| Mexico | 2.62 | 1.14 | 128,455,567 |
| Thailand | 2.58 | 1.22 | 71,801,279 |
| Costa Rica | 2.57 | 1.51 | 5,212,173 |
| Samoa | 2.52 | 1.82 | 225,681 |
| Saint Lucia | 2.50 | 0.33 | 180,251 |
| French Guiana | 2.33 | 94.42 | 312,155 |
| Mauritania | 2.31 | 3.91 | 4,862,989 |
| Algeria | 2.30 | 0.50 | 45,606,480 |
| Dominica | 2.29 | 1.02 | 73,040 |
| Panama | 2.27 | 2.71 | 4,468,087 |
| Djibouti | 2.25 | 0.72 | 1,136,455 |
| Vietnam | 2.24 | 1.00 | 98,858,950 |
| Georgia | 2.18 | 1.27 | 3,728,282 |
| Gabon | 2.17 | 21.45 | 2,436,566 |
| Peru | 2.15 | 3.62 | 34,352,719 |
| Tunisia | 2.15 | 0.68 | 12,458,223 |
| Namibia | 2.10 | 6.19 | 2,604,172 |
| Albania | 2.05 | 0.99 | 2,832,439 |
| Ghana | 2.04 | 1.35 | 34,121,985 |
| Uzbekistan | 2.00 | 0.94 | 35,163,944 |
| Laos | 2.00 | 1.76 | 7,633,779 |
| El Salvador | 1.99 | 0.57 | 6,364,943 |
| Azerbaijan | 1.97 | 0.74 | 10,412,651 |
| Jordan | 1.93 | 0.16 | 11,337,052 |
| Colombia | 1.91 | 3.60 | 52,085,168 |
| Solomon Islands | 1.88 | 4.00 | 740,424 |
| Moldova | 1.87 | 1.25 | 3,435,931 |
| Cuba | 1.82 | 0.78 | 11,194,449 |
| Papua New Guinea | 1.82 | 3.48 | 10,329,931 |
| Jamaica | 1.81 | 0.39 | 2,825,544 |
| Iraq | 1.80 | 0.19 | 45,504,560 |
| Armenia | 1.80 | 0.63 | 2,777,970 |
| Equatorial Guinea | 1.80 | 2.52 | 1,714,671 |
| Egypt | 1.78 | 0.40 | 112,716,598 |
| Guatemala | 1.78 | 0.96 | 18,092,026 |
| Morocco | 1.77 | 0.73 | 37,840,044 |
| Dominican Republic | 1.75 | 0.60 | 11,332,972 |
| Nicaragua | 1.74 | 2.20 | 7,046,310 |
| Myanmar | 1.71 | 1.83 | 54,577,997 |
| Ecuador | 1.71 | 1.95 | 18,190,484 |
| Guinea | 1.68 | 1.99 | 14,190,612 |
| Chad | 1.67 | 1.78 | 18,278,568 |
| Indonesia | 1.66 | 1.22 | 277,534,122 |
| Sao Tome And Principe | 1.62 | 0.83 | 231,856 |
| Niger | 1.56 | 1.28 | 27,202,843 |
| Kyrgyzstan | 1.55 | 1.18 | 6,735,347 |
| Honduras | 1.54 | 1.53 | 10,593,798 |
| Sri Lanka | 1.49 | 0.42 | 21,893,579 |
| Lesotho | 1.47 | 0.77 | 2,330,318 |
| Guinea Bissau | 1.45 | 2.77 | 2,150,842 |
| Mali | 1.44 | 1.45 | 23,293,698 |
| Ivory Coast | 1.42 | 2.00 | 28,873,034 |
| Benin | 1.41 | 0.89 | 13,712,828 |
| Philippines | 1.34 | 0.54 | 117,337,368 |
| Sudan | 1.33 | 1.21 | 48,109,006 |
| Cambodia | 1.33 | 1.07 | 16,944,826 |
| Cameroon | 1.26 | 1.60 | 28,647,293 |
| India | 1.19 | 0.43 | 1,428,627,663 |
| Central African Republic | 1.17 | 7.52 | 5,742,315 |
| Syria | 1.16 | 0.44 | 23,227,014 |
| Senegal | 1.16 | 0.94 | 17,763,163 |
| Comoros | 1.14 | 0.33 | 852,075 |
| Burkina Faso | 1.12 | 0.89 | 23,251,485 |
| Liberia | 1.11 | 2.24 | 5,418,377 |
| Nepal | 1.09 | 0.56 | 30,896,590 |
| Togo | 1.09 | 0.51 | 9,053,799 |
| Republic Of The Congo | 1.07 | 8.94 | 6,106,869 |
| Uganda | 1.04 | 0.46 | 48,582,334 |
| Zimbabwe | 1.03 | 0.48 | 16,665,409 |
| Nigeria | 1.02 | 0.63 | 223,804,632 |
| Ethiopia | 1.01 | 0.57 | 126,527,060 |
| Sierra Leone | 1.00 | 0.87 | 8,791,092 |
| Kenya | 0.99 | 0.47 | 55,100,586 |
| Zambia | 0.97 | 1.85 | 20,569,737 |
| Tajikistan | 0.97 | 0.51 | 10,143,543 |
| Somalia | 0.95 | 0.83 | 18,143,378 |
| Gambia | 0.93 | 0.69 | 2,773,168 |
| Angola | 0.92 | 1.87 | 36,684,202 |
| Madagascar | 0.92 | 2.28 | 30,325,732 |
| Malawi | 0.90 | 0.69 | 20,931,751 |
| Pakistan | 0.86 | 0.35 | 240,485,658 |
| Bangladesh | 0.83 | 0.40 | 172,954,319 |
| Palestine | 0.81 | 0.09 | 5,371,230 |
| Mozambique | 0.80 | 1.73 | 33,897,354 |
| Timor Leste | 0.74 | 1.49 | 1,360,596 |
| Rwanda | 0.67 | 0.36 | 14,094,683 |
| Afghanistan | 0.66 | 0.37 | 42,239,854 |
| Haiti | 0.64 | 0.29 | 11,724,763 |
| Burundi | 0.63 | 0.36 | 13,238,559 |
| Yemen | 0.61 | 0.37 | 34,449,825 |
| Venezuela | 0.57 | 0.54 | 28,838,499 |
| Eritrea | 0.51 | 1.58 | 3,748,901 |
| Tanzania | 0.28 | 0.28 | 67,438,106 |
| South Korea | 0.17 | 0.00 | 51,784,059 |
| Iran | 0.10 | 0.07 | 89,172,767 |
| Dr Congo | 0.01 | 0.26 | 102,262,808 |
| North Korea | 0.00 | 0.00 | 26,160,821 |
Tags: Ecology, Environment, Nature, Resources
DISCLAIMER: The statements, views and opinions expressed in pieces republished here are solely those of the authors and do not necessarily represent those of TMS. In accordance with title 17 U.S.C. section 107, this material is distributed without profit to those who have expressed a prior interest in receiving the included information for research and educational purposes. TMS has no affiliation whatsoever with the originator of this article nor is TMS endorsed or sponsored by the originator. “GO TO ORIGINAL” links are provided as a convenience to our readers and allow for verification of authenticity. However, as originating pages are often updated by their originating host sites, the versions posted may not match the versions our readers view when clicking the “GO TO ORIGINAL” links. This site contains copyrighted material the use of which has not always been specifically authorized by the copyright owner. We are making such material available in our efforts to advance understanding of environmental, political, human rights, economic, democracy, scientific, and social justice issues, etc. We believe this constitutes a ‘fair use’ of any such copyrighted material as provided for in section 107 of the US Copyright Law. In accordance with Title 17 U.S.C. Section 107, the material on this site is distributed without profit to those who have expressed a prior interest in receiving the included information for research and educational purposes. For more information go to: http://www.law.cornell.edu/uscode/17/107.shtml. If you wish to use copyrighted material from this site for purposes of your own that go beyond ‘fair use’, you must obtain permission from the copyright owner.