
After 40 Years, Researchers Finally See Earth’s Climate Destiny More Clearly
ENVIRONMENT, 27 Jul 2020
Paul Voosen | Science Magazine - TRANSCEND Media Service
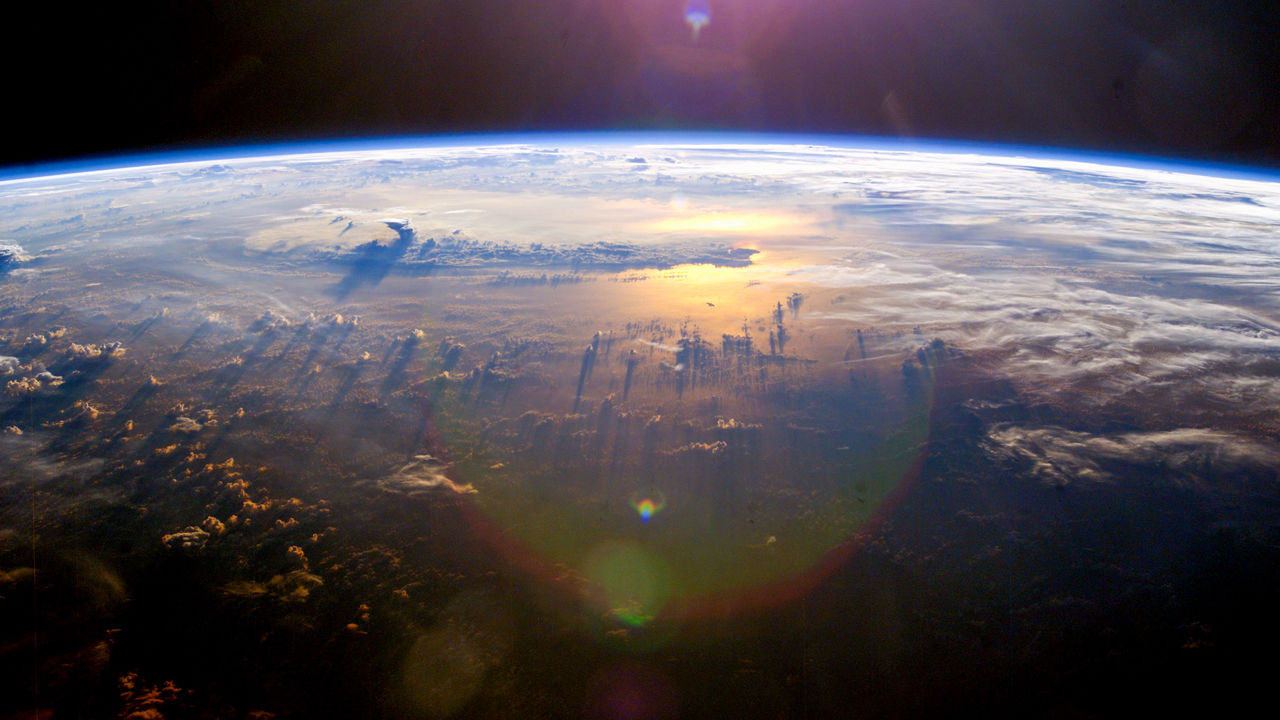
Clouds aren’t expected to dampen global warming—one reason that the planet is likely to respond sharply to carbon emissions. ISS Expedition 7 Crew/EOL/NASA
22 Jul 2020 – It seems like such a simple question: How hot is Earth going to get? Yet for 40 years, climate scientists have repeated the same unsatisfying answer: If humans double atmospheric carbon dioxide (CO2) from preindustrial levels, the planet will eventually warm between 1.5°C and 4.5°C—a temperature range that encompasses everything from a merely troubling rise to a catastrophic one.
Now, in a landmark effort, a team of 25 scientists has significantly narrowed the bounds on this critical factor, known as climate sensitivity. The assessment, conducted under the World Climate Research Programme (WCRP) and publishing this week in Reviews of Geophysics, relies on three strands of evidence: trends indicated by contemporary warming, the latest understanding of the feedback effects that can slow or accelerate climate change, and lessons from ancient climates. They support a likely warming range of between 2.6°C and 3.9°C, says Steven Sherwood, one of the study’s lead authors and a climate scientist at the University of New South Wales. “This is the number that really controls how bad global warming is going to be.”
The new study is the payoff of decades of advances in climate science, says James Hansen, the famed retired NASA climate scientist who helped craft the first sensitivity range in 1979. “It is an impressive, comprehensive study, and I am not just saying that because I agree with the result. Whoever shepherded this deserves our gratitude.”
Humanity has already emitted enough CO2 to be halfway to the doubling point of 560 parts per million, and many emissions scenarios have the planet reaching that threshold by 2060. The report underscores the risks of that course: It rules out the milder levels of warming sometimes invoked by those who would avoid emissions cuts. “For folks hoping for something better, those hopes are less grounded in reality,” says David Victor, a climate policy researcher at the University of California, San Diego, who was not part of the study.
The WCRP sensitivity estimate is designed to be used by the United Nations’s Intergovernmental Panel on Climate Change (IPCC) when it publishes its next major report in 2021 or 2022. The estimate will also inform projections for sea-level rise, economic damage, and much else. A clearer picture of those consequences could do much to spur local governments to cut emissions and adapt to warming, says Diana Reckien, a climate planning expert at the University of Twente. “The decreasing uncertainty could potentially motivate more jurisdictions to act.”
The study dispels uncertainty introduced by the latest climate models. Models have historically been used to estimate sensitivity, beginning in 1979, with the world’s first comprehensive assessment of CO2-driven climate change. That summer, at a meeting in Woods Hole, Massachusetts, led by Jule Charney, scientists produced a paper, known ever since as the Charney report, that predicted between 1.5°C and 4.5°C warming for a CO2 doubling. Those numbers—based in part on a model Hansen had developed—stuck around far longer than anyone imagined: The latest IPCC report, from 2013, gave the same range.
Recent models suggest the range might even go higher. They run hot, some predicting warming of more than 5°C for a CO2 doubling, apparently because of the way they render clouds, especially over the Southern Ocean. Yet these high-end models struggle to accurately recreate the climate of the 20th century, undermining their credibility. Such models play only a supporting role in the new assessment, says Robert Kopp, a climate scientist at Rutgers University, New Brunswick, who was not involved in the effort. “We now have enough independent lines of evidence that we don’t need to use the climate models as their own line.”
The WCRP study arose out of a 2015 workshop at Schloss Ringberg, a castle in the Bavarian Alps. Many participants were dissatisfied with the IPCC process and wanted to look at how physical mechanisms might set the boundaries of the sensitivity range. “Work on the ends, rather than on the middle,” says Bjorn Stevens, a cloud scientist at the Max Planck Institute for Meteorology, who edited the WCRP report with Sandrine Bony of the Pierre Simon Laplace Institute. Sherwood and Mark Webb, a climate scientist at the United Kingdom’s Met Office, agreed to lead the effort.
The first line of evidence they considered was modern-day warming. Since record keeping began in the 1800s, average surface temperatures have risen by 1.1°C. Continuing that trend into the future would lead to warming on the lower end of the range. But recent observations have shown the planet is not warming uniformly; in particular, warming has barely touched parts of the eastern Pacific Ocean and Southern Ocean, where cold, deep waters well up and absorb heat. Eventually, models and paleoclimate records suggest, these waters will warm—not only eliminating a heat sink, but also spurring the formation of clouds above them that will trap more heat. Adjusting the temperature projections for this fact rules out low-sensitivity estimates, says Kate Marvel, a climate scientist at NASA’s Goddard Institute for Space Studies.
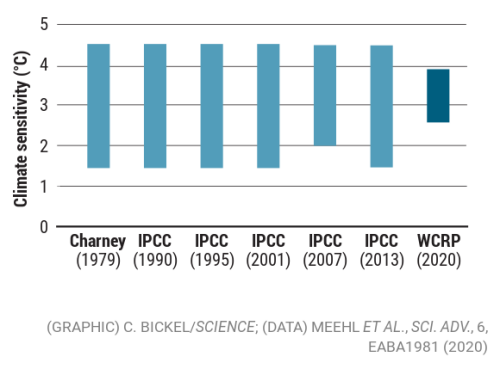
A hot number: Bounds on Earth’s climate sensitivity—how far temperatures will eventually rise for a doubling of atmospheric carbon dioxide—did not narrow for 40 years. Using new lines of evidence, a major study now says substantial warming is likely.
Second, the team probed individual climate feedbacks. Some of these, like the warming effect of water vapor, are well known. But clouds, which can cool or warm the planet depending on how they reflect sunlight and trap heat, have long been a wild card. In particular, climate scientists want to understand the decks of stratocumulus clouds that form off coastlines. If they grow more extensive in response to warming, as some suspect, they could have a cooling effect.
Several years ago, a suite of high-resolution cloud models identified two feedbacks that would have the opposite effect, thinning clouds and making warming worse. In the models, higher temperatures allowed more dry air to penetrate thin clouds from above, preventing them from thickening. At the same time, higher CO2 levels trapped heat near the clouds’ tops, subduing turbulence that drives the formation of more clouds. Satellites have since observed these dynamics in warmer-than-average parts of the atmosphere. “There’s a growing consensus that the [cloud] feedback is positive, but not super large,” says Thorsten Mauritsen, a climate scientist at Stockholm University.
Finally, the team looked at records from two past climates—20,000 years ago, at the peak of the last ice age, and a warm period 3 million years ago, the last time atmospheric CO2 levels were similar to today’s. Recent work suggests climate sensitivity is not a fixed property of the planet, but changes over time. During warm periods, for instance, the absence of ice sheets probably raised sensitivity. Records of ancient temperatures and CO2 levels enabled the team to pin down sensitivities of 2.5°C and 3.2°C for the cold and warm periods, respectively. “It’s really comprehensive,” says Jessica Tierney, a paleoclimatologist at the University of Arizona, who was not part of the report. Even for the coldest climate state, she says, the possibility of a sensitivity below 2°C seems negligible.
Assembling the three lines of evidence was a huge task. But wiring them together for a unified prediction was even tougher, Marvel says. The team used Bayesian statistics to churn through its assembled data, which allowed the researchers to test how their assumptions influence the results. “The real advantage” of Bayesian statistics, Tierney says, is how it allows uncertainties at each stage to feed into a final result. Co-authors often butted heads, Marvel says. “It was such a long and painful process.” The final range represents a 66% confidence interval, matching IPCC’s traditional “likely” range. The WCRP team also calculated a 90% confidence interval, which ranges from 2.3°C to 4.7°C, leaving a slight chance of a warming above 5°C.
Either way, the report has a simple takeaway, Sherwood says: A doubling of CO2 all but guarantees warming of more than 2°C. “Three major lines of evidence are all very difficult to reconcile with the lower end of climate sensitivity.”
In recent years, another uncertainty in the climate future has also narrowed: Global emissions seem unlikely to reach the worst-case scenarios IPCC helped craft 15 years ago, ruling out some forecasts of extreme warming. “We’re light-years ahead of where we were in 1979,” says Reto Knutti, a co-author and climate scientist at ETH Zurich.
Unfortunately, the years of work needed to attain that certainty came with a cost: 4 decades of additional emissions and global warming, unabated.
________________________________________________
Download PDF file:
An Assessment of Earth Climate Sensitivity Using Multiple Lines of Evidence

Paul Voosen is a staff writer who covers Earth and planetary science.
Go to Original – sciencemag.org
Tags: Climate Change, Earth, Ecology, Environment, Global warming, Science
DISCLAIMER: The statements, views and opinions expressed in pieces republished here are solely those of the authors and do not necessarily represent those of TMS. In accordance with title 17 U.S.C. section 107, this material is distributed without profit to those who have expressed a prior interest in receiving the included information for research and educational purposes. TMS has no affiliation whatsoever with the originator of this article nor is TMS endorsed or sponsored by the originator. “GO TO ORIGINAL” links are provided as a convenience to our readers and allow for verification of authenticity. However, as originating pages are often updated by their originating host sites, the versions posted may not match the versions our readers view when clicking the “GO TO ORIGINAL” links. This site contains copyrighted material the use of which has not always been specifically authorized by the copyright owner. We are making such material available in our efforts to advance understanding of environmental, political, human rights, economic, democracy, scientific, and social justice issues, etc. We believe this constitutes a ‘fair use’ of any such copyrighted material as provided for in section 107 of the US Copyright Law. In accordance with Title 17 U.S.C. Section 107, the material on this site is distributed without profit to those who have expressed a prior interest in receiving the included information for research and educational purposes. For more information go to: http://www.law.cornell.edu/uscode/17/107.shtml. If you wish to use copyrighted material from this site for purposes of your own that go beyond ‘fair use’, you must obtain permission from the copyright owner.