
Oral Cancer in Florida – World No Tobacco Day
HEALTH, 14 Jun 2021
Vidushi Prasad - TRANSCEND Media Service
Abstract
The project aimed at oral cancer in Florida to find a co-relation of incidence rate, death rate, licensed dentist, access to dental care to low-income population, hospital accessibility and the racial disparity related to oral cancer incidence. The data obtained from Florida Cancer Data System and Florida Department of Health of 2009-2011. The data was cleaned up and join to Florida shapefile. The different variables were mapped using choropleth and gradual symbol mapping technique. The Cancer hospitals were geocoded and buffered to find the accessibility; it was observed that there is high death rate in area outside the buffer zone. This study showed that Union has highest incidence rate, highest death rate, with the lowest number of licensed dentist and moderate access to dental care to the low-income population. There are more incidence and death rate in the north of Florida as compared to the south. There is high oral cancer incidence in Whites as compared to Blacks.
Background and significance
Oral Cancer is a subtype of head and neck cancer occurring in an oral cavity. It is a cancerous tissue growth that may involve tongue, the floor of mouth, cheek, gingiva, palate, lips or oropharynx. Oral cancer may be of different types adenocarcinoma, lymphoma, melanoma, but most common is squamous cell carcinoma. Oral cancer is one of the chronic diseases that results in high mortality rate due to late diagnosis. In 2012, the prevalence of oral cancer in U S was among 291,108 people. The five-year survival rates in the United States are 63%. (http://seer.cancer.gov/statfacts/html/oralcav.html ). The common causes of oral cancer are tobacco, areca nut, alcohol, and human papillomavirus. As oral cancer is common among tobacco users, Florida stands 18th in rank among all states with a high number of cigarette smokers. In Florida, 17.5% of the adult population that is over 2,509,000 individuals are current smokers.
(http://www.cdc.gov/tobacco/data_statistics/state_data/state_highlights/2010/states/florida/)
As per Guo Y study conducted in Florida to find the racial disparities in oral and pharyngeal cancer in 2008. They obtained the data from Florida Cancer Data System and calculated the annual percentage change in each group to find the trend of incidence in different races. They found that blacks had lower level of diagnosis whereas whites have increased the incidence of late-stage diagnosis. It suggests that there is need of emphasising the screening for oral cancer among underserved populations. (Guo, Yi., et al. 2013)
Oral Cancer incidence and death rates in counties in Florida can be mapped, so that better understanding of cases distributed in the state can be visualized. The highest incidence rate of oral cancer is in Union and lowest incidence rate is in Madison. The correlation of some other factors like availability of licensed dentist and access to dental care to the low-income population, about oral cancer incidence, is mapped. The data obtained from Florida Department of Health, Division of Public Health Statistics & Performance Management. The racial disparities and oral cancer incidence rate have been analysed through map obtained from Florida Cancer Data System. Thus the spatial epidemiological survey of oral cancer helps in determining the region with the highest number of cases, this information can be helpful in formulating the required public health policy and conducting the oral cancer awareness programs in that regions.
Data and Methods
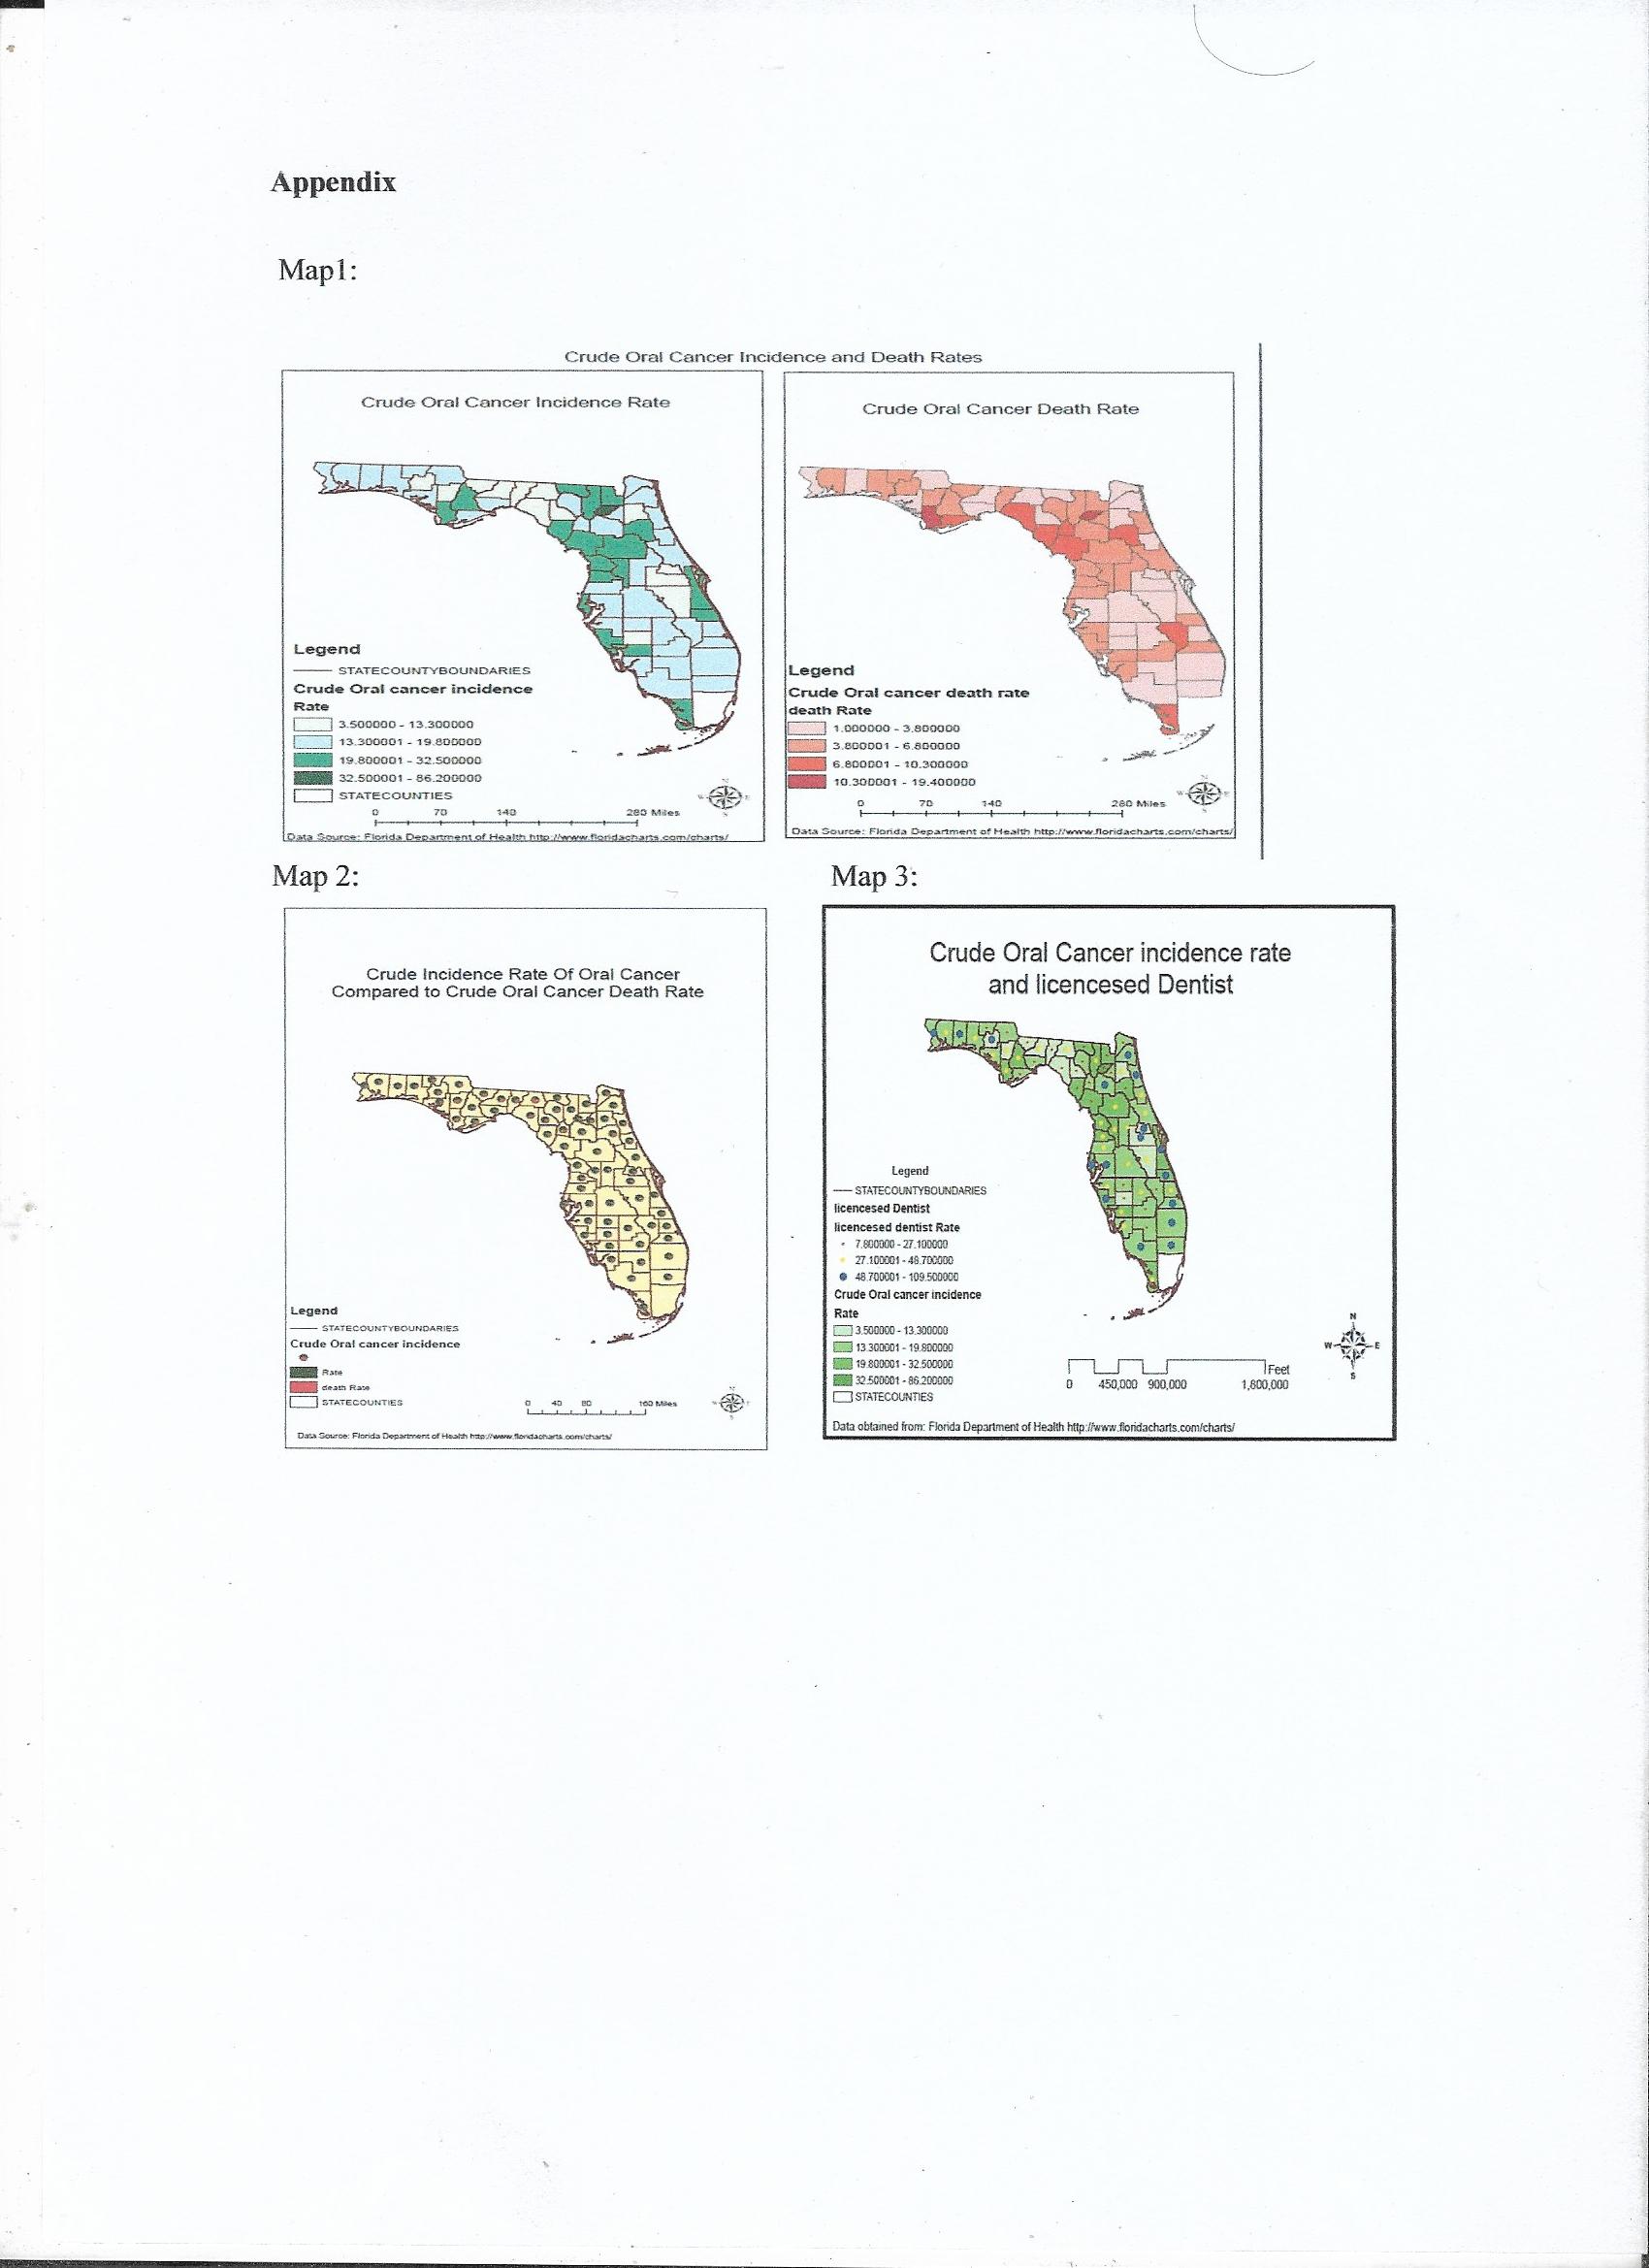
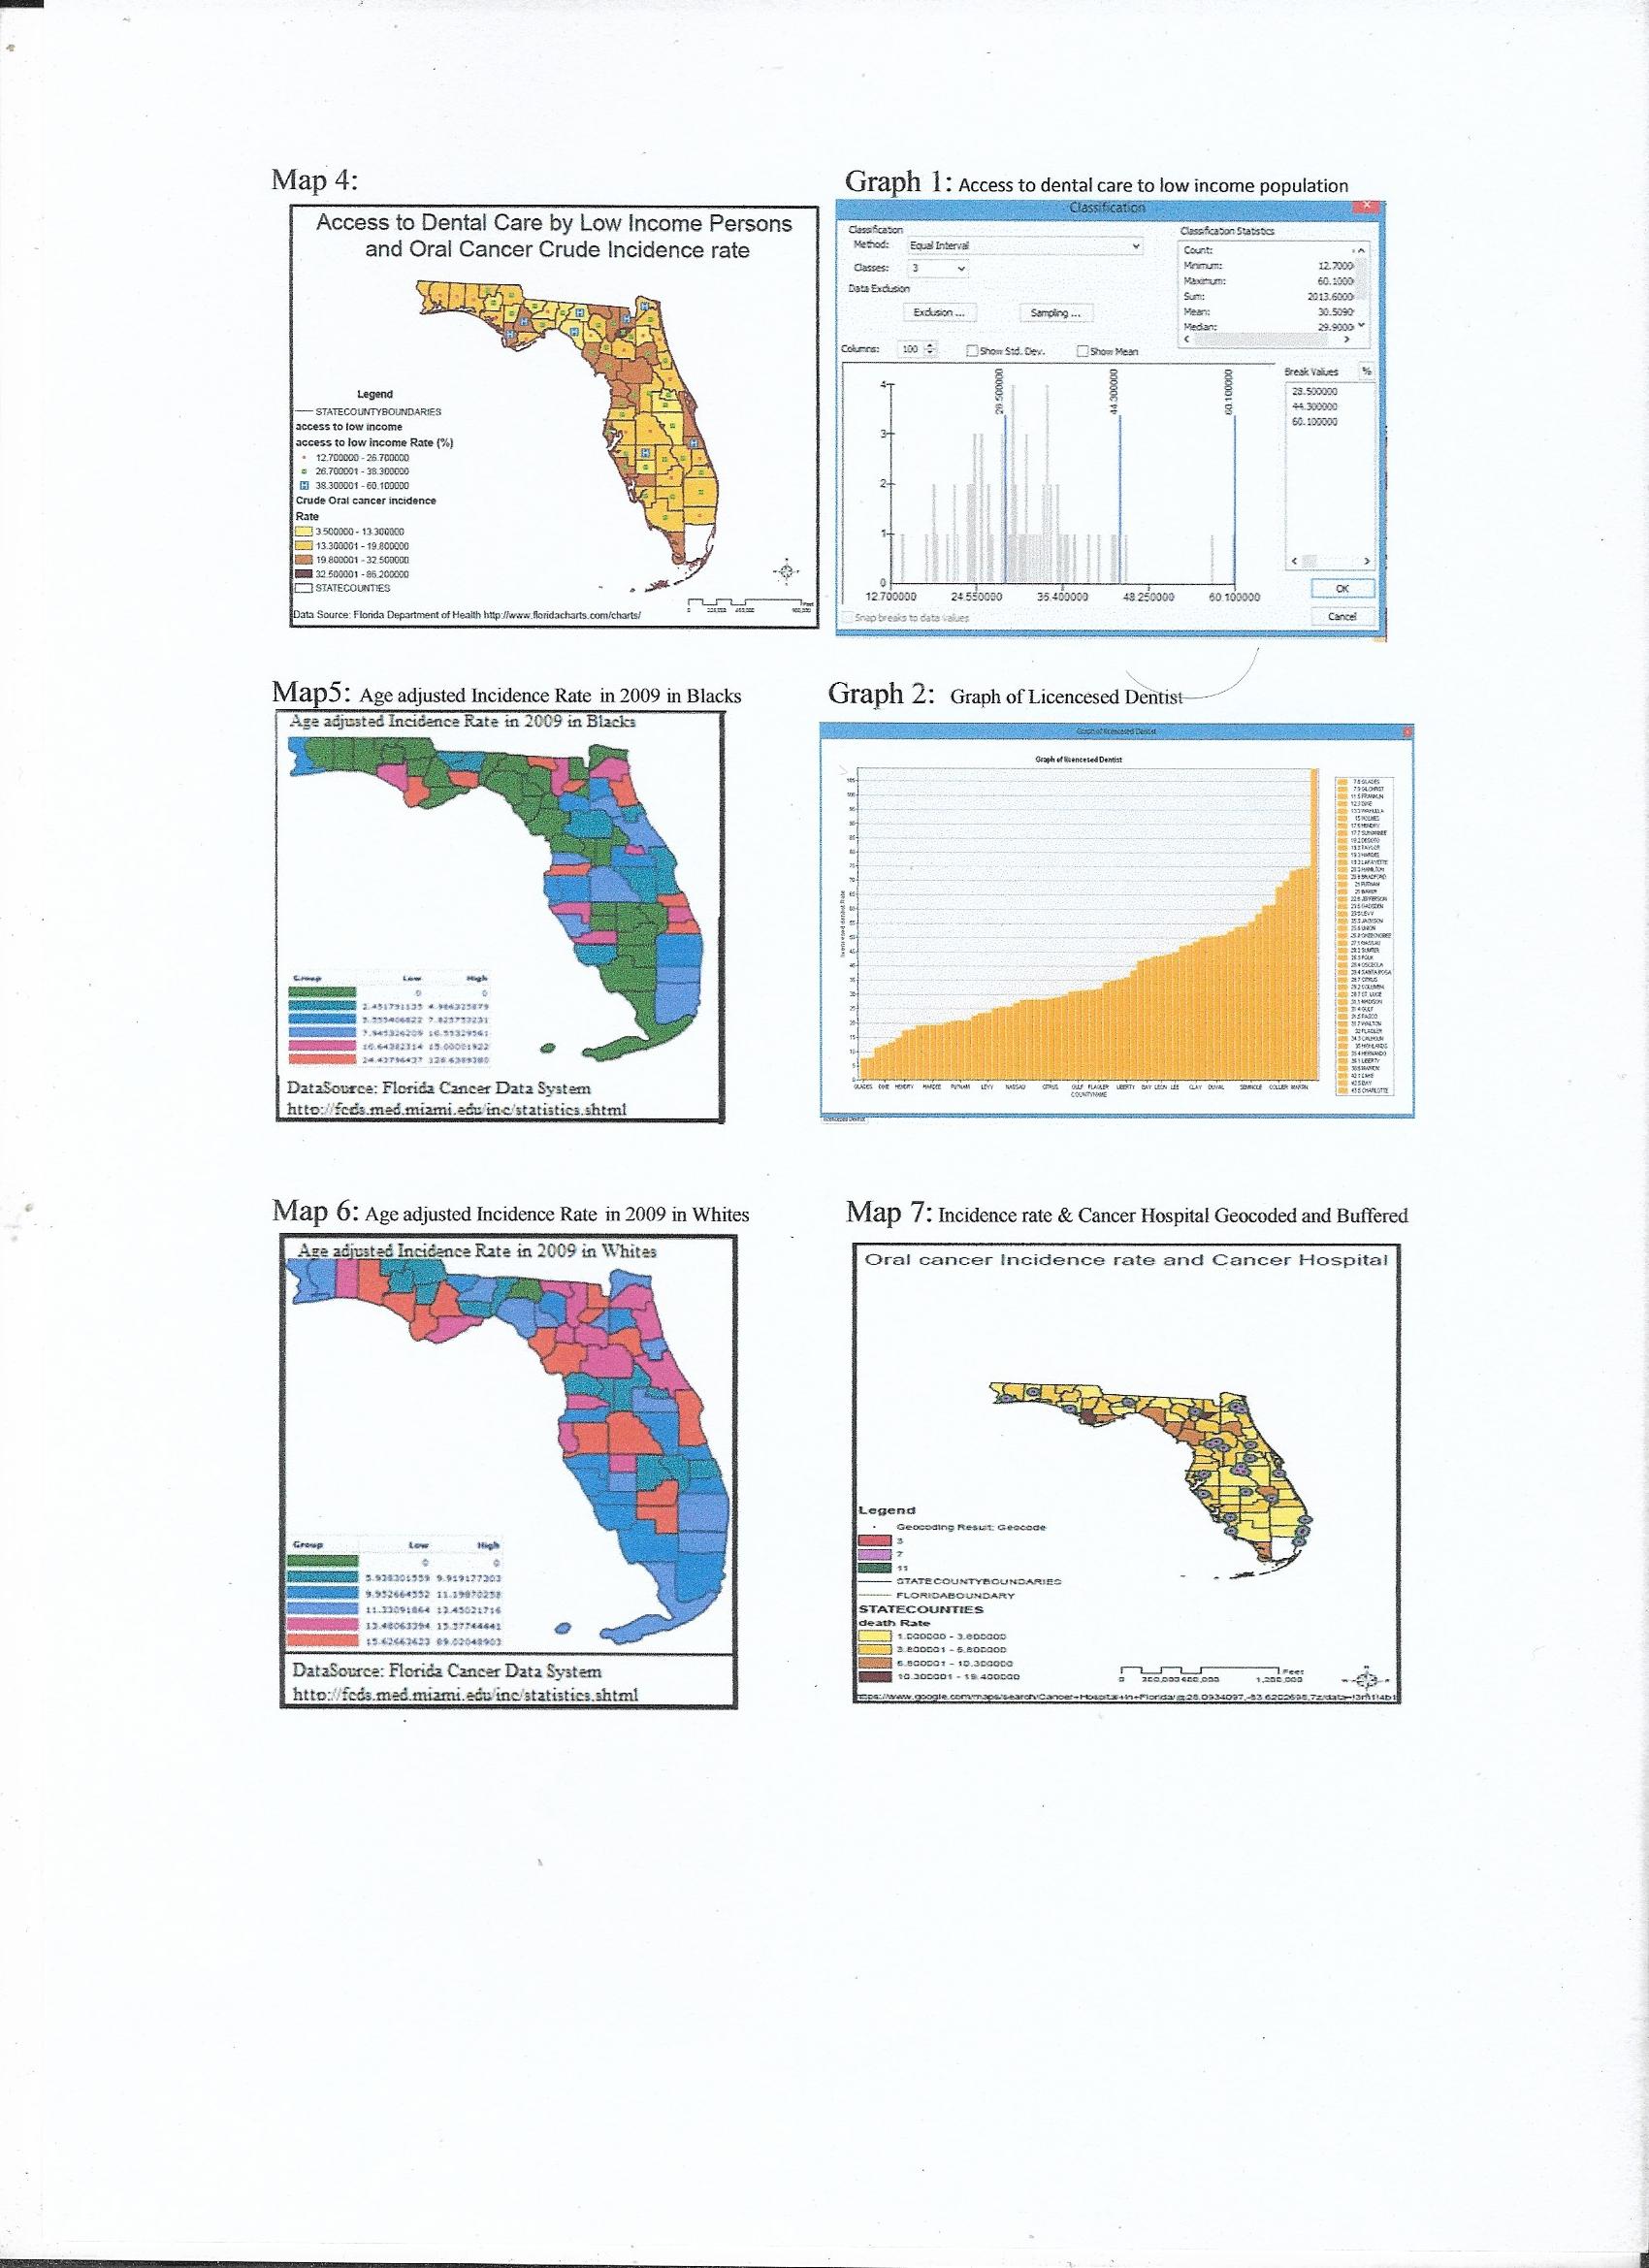
Steps in data preparation: At first the Florida map shape file was downloaded and stored in the project folder. The data was obtained from Florida Department of Health, Division of Public Health Statistics & Performance Management. The data related to oral cancer crude incidence rate and crude death rate in 2009 to 2011 in Florida was downloaded as an excel file. The Excel file contained some unnecessary text that need to be edited, so the cleanup of the data was done by removing some of the columns and capitalizing the county name to match with the county name in the attribute table of the map layer. The map displayed has rates and not the count, as rate are more logical to compare, so the column of counts has been removed from the excel file. Similarly, the data related to the rate of access to dental care for low-income people and percentage of licensed dentist in 2009 to 2011 data was obtained and cleaned. The project datasets are then transferred to a new geodatabase. Then the data was joined to Florida map using county name as a common field in the layer and table. After creating a join using Arc Map (Map1 and Map2) was build having two maps showing incidence and death rates using choropleth map design and one with pie charts. The (map 3) was based on a comparison of licence dentist to incidence rate using choropleth map showing incidence and licensed dentist with gradual symbol map. Similarly the (map 4) was made to demonstrate the incidence rate and access to dental care to low-income people. (Map 5 and 6) was created using the Florida Cancer Data System online showing age-adjusted incidence rate of oral cancer in 2009 at ten anatomical sites of oral and pharyngeal structure in both the sexes concerning (map 5) for Blacks and (map 6) for Whites. For (Map7) the excel file was created using the Google map and finding the address of cancer hospitals. Excel file with address, zip code was created, then with zip code the address were geocoded and mapped.
Inputs and Sources: The (map 1 to 4) were built on the data collected from Florida Department of Health, Division of Public Health Statistics & Performance Management. This data is a secondary source originally obtained from University of Miami (Fl) Medical School, Florida Cancer Data System. The census data has been revised to ensure the prediction matches the actual data accurately about race, gender and population distribution. The Arc GIS map used to construct the maps. The Florida map shapefile downloaded from Shapefile Library of Southwest Florida Water Management District. The (map 5 and 6) were generated online on Florida Cancer Data System. Apart from obtaining these data some of the literature have been reviewed, the article by Guo Y study conducted in Florida to find the racial disparities in oral and pharyngeal cancer in 2008 and one of the articles by Tomar, S. L. et al. (2004) Racial differences in oral and pharyngeal cancer treatment and survival in Florida. This project is build based on the similar approach of comparison of race, death rate, access and availability of dental resources in Florida. The (map 7) was created by data gathered from Google map related to Cancer hospital in Florida. (Map 8) generated by USGS online.
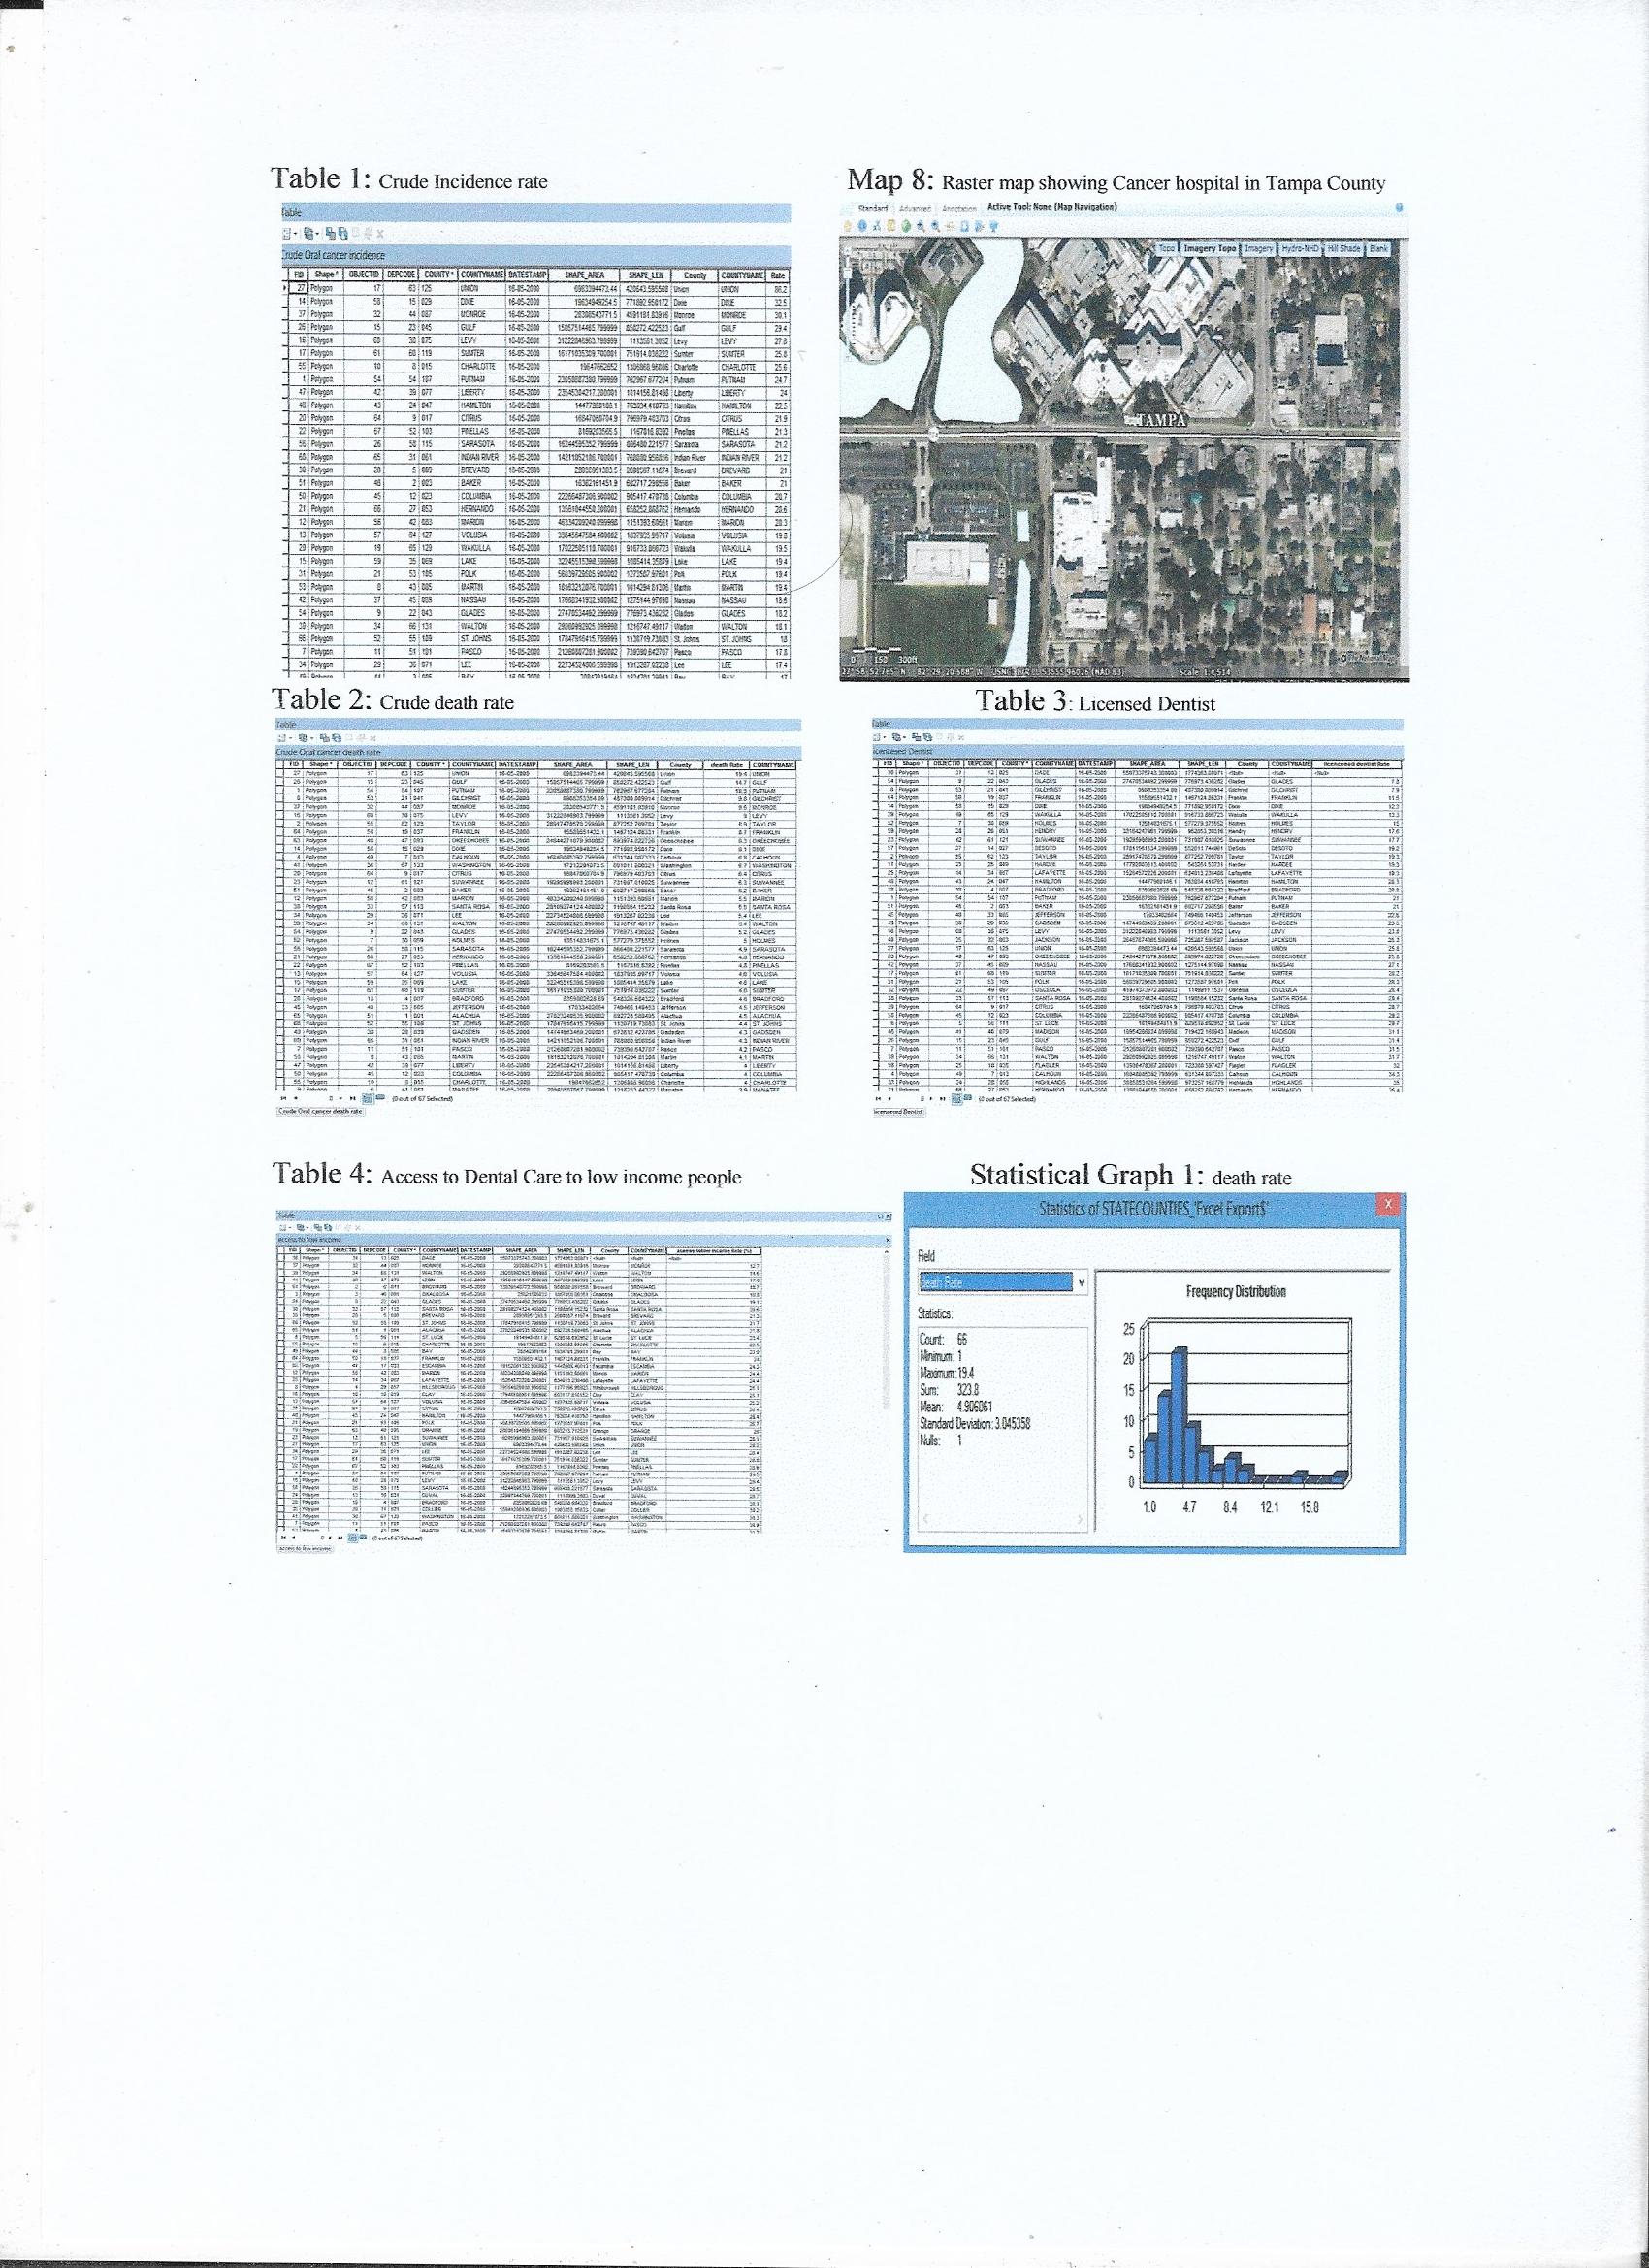
Steps in GIS database and spatial analysis construction: The Cancer Hospitals in Florida were Geocoded with ZIP Code data using North America Geocode Service of Arc GIS online and got the match of 98%. The spatial join was created to form choropleth map showing death rate of oral cancer. The geocoded hospital location is then buffered for 3, 7 and 11 miles to conduct proximity analysis with multiple ring buffers to create (map7). The graphs and tables were constructed using the maps to analyse the data. The attribute table was used to sort the field of interest such as incidence rate, death rate, access to dental care to low-income people and licensed dentist. To analyse the mean of access to dental care to low-income population (graph 1) was designed with equal interval using Arc GIS and (graph 2) of licensed dentist in different countries was made.
Map Design: The thematic map was used to demonstrate the change in incidence rate and death rate of oral cancer using choropleth map in (Map1). It demonstrates the quantitative data as the different sequential colour within a geographic area representing increasing range of values. (Map 2-4) Have gradual symbols, displaying the proportionally sized symbol representing the difference in occurrence that used to map the distribution of access to dental care to low-income people, death rate and licensed dentist at the same time comparing these factors with choropleth map of incidence of oral cancer. The equal interval has been used to classify the range used on the map. As this method sets the value ranges in each category equal in size. The entire range of data values is divided equally into however many categories have been chosen. The (map7) show gradual change in colour with chorolpeth map showing daeth rate and dots represent geocoded cancer hospital whereas buffer rings shows the different mile range i.e. 3, 7 and 11 miles from hospital. The planer projection has been used for more detail and little distortion. The small scale map was generated showing relatively large area but with not much detail as looking for whole Florida state and different counties. The (map8) is downloaded using USGS raster map. The area near Cancer hospital has been zoomed in Tampa County.
Results
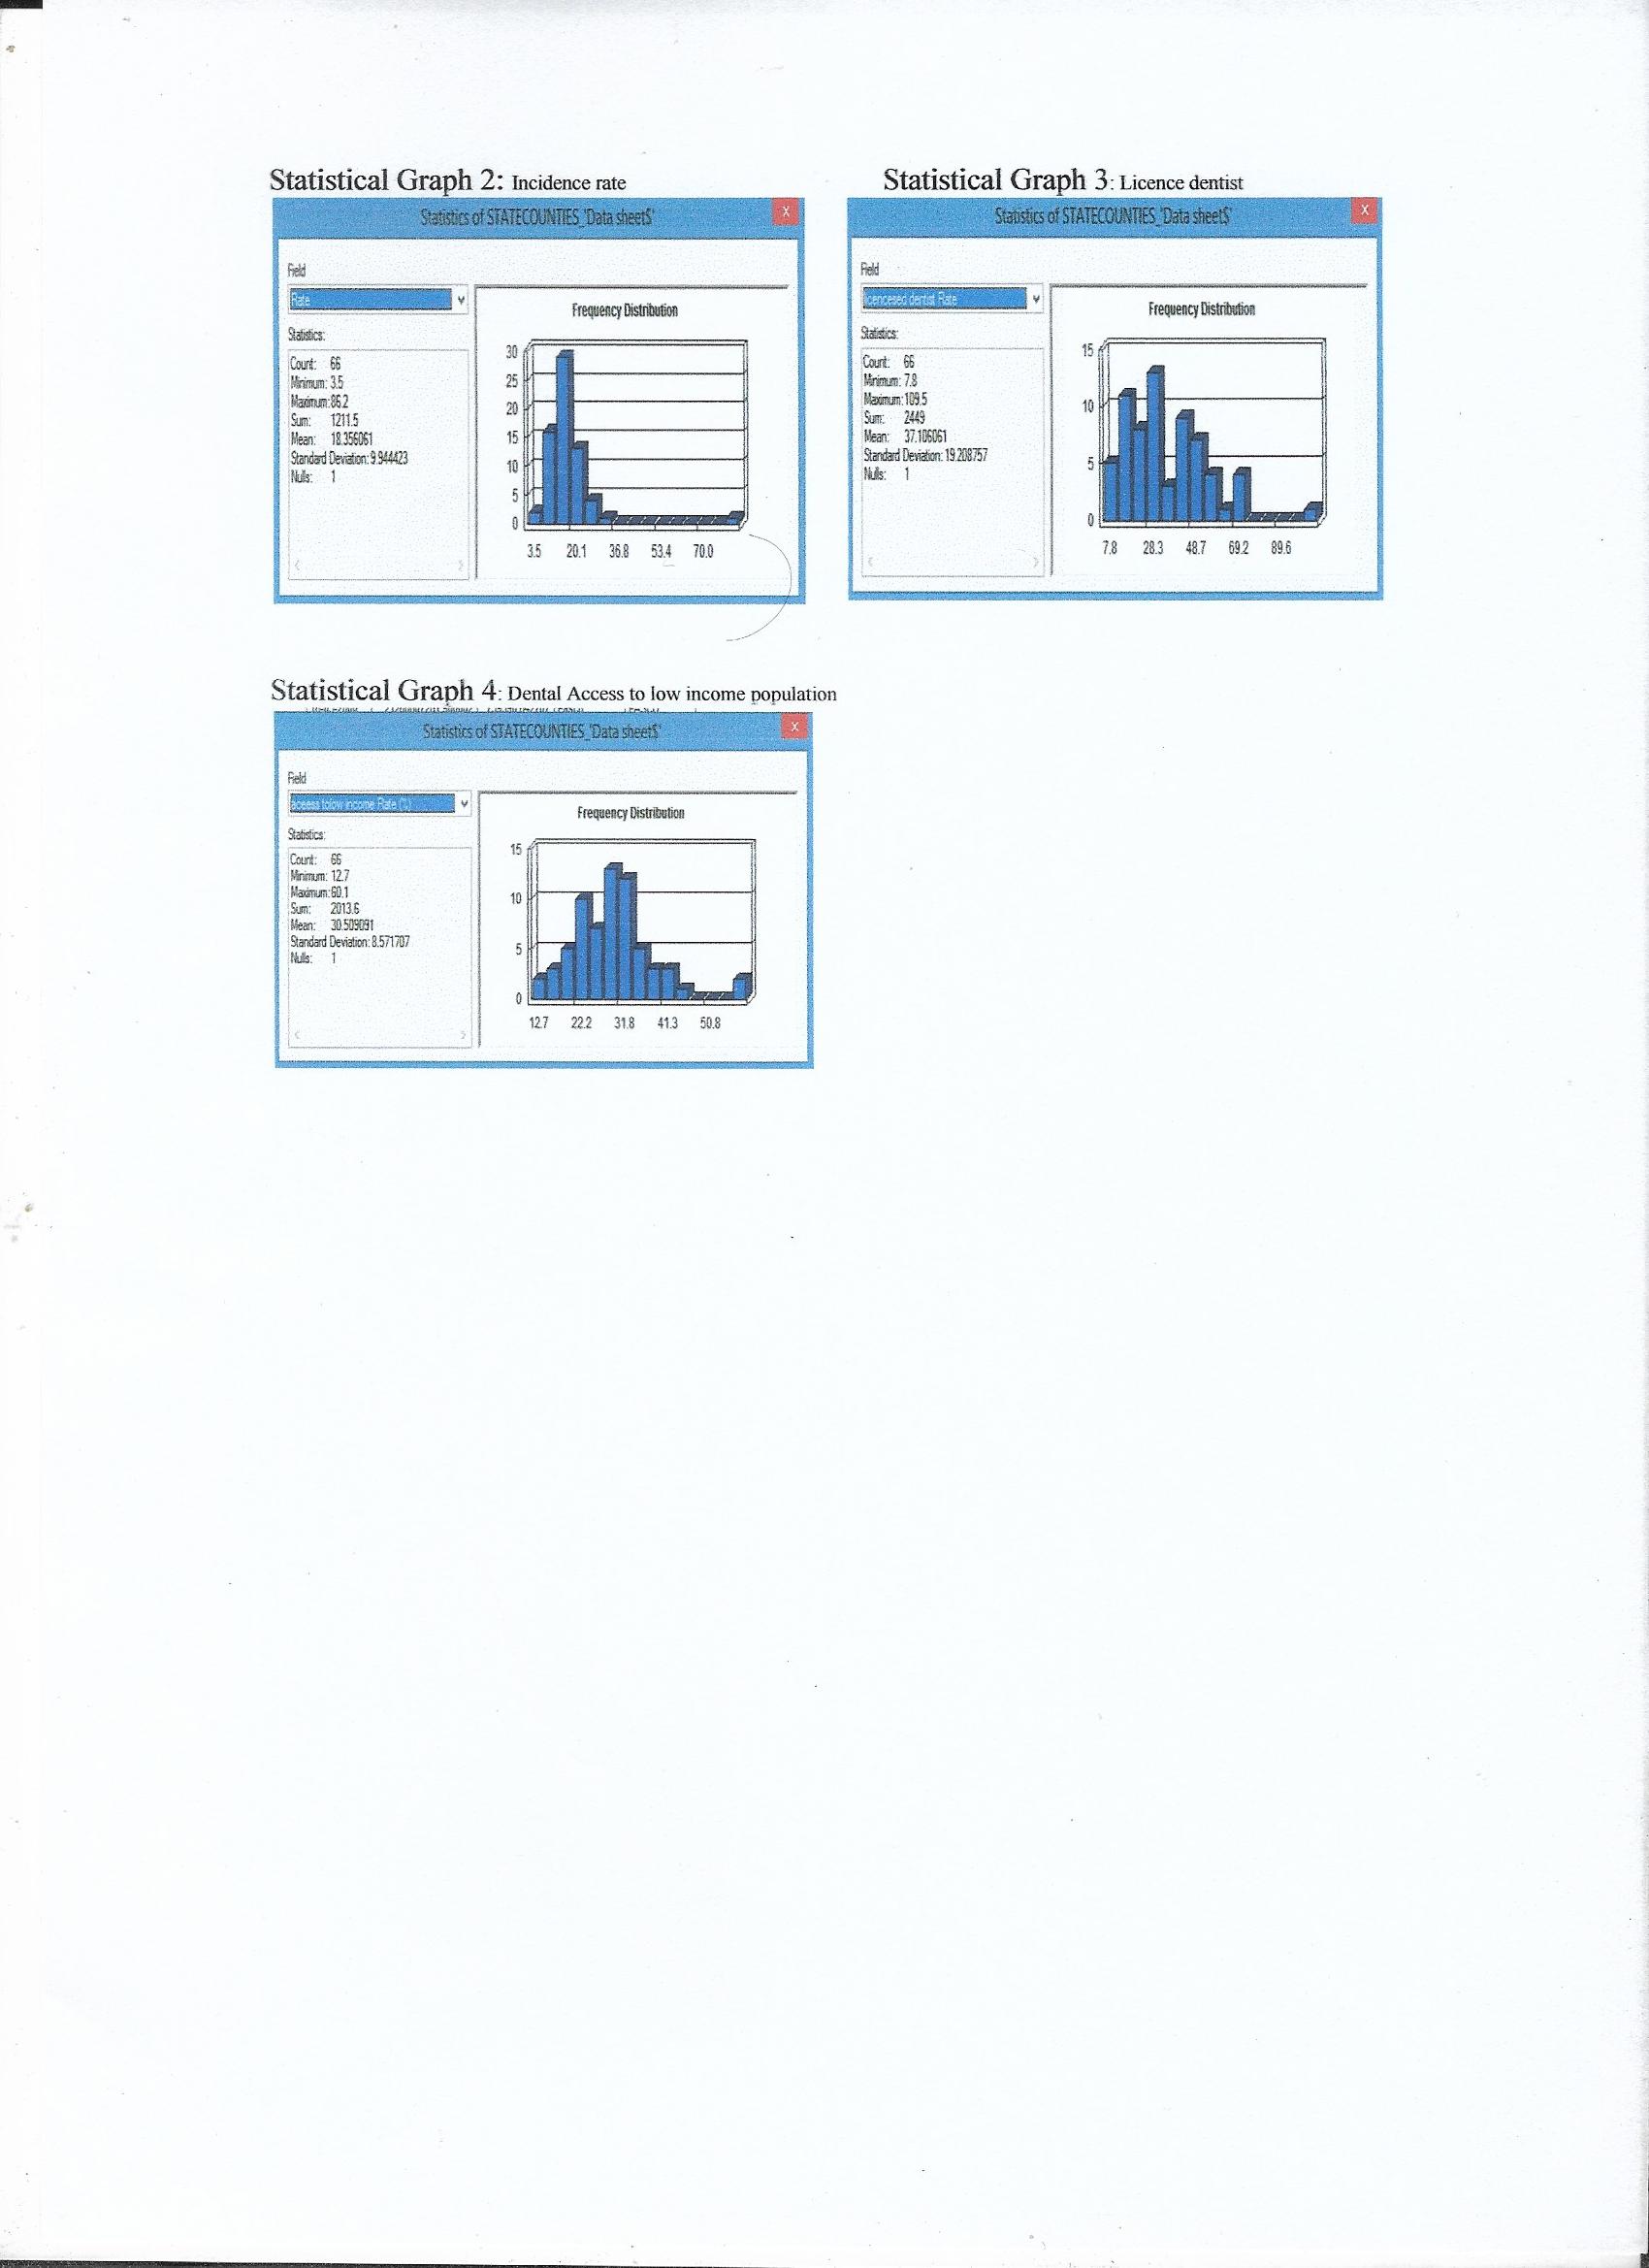
The (map1 and 2) compares the incidence rate and death rate due to oral cancer. As per this map and (Table 1 and 2) Union has highest incidence rate as well as highest death rate and Madison has lowest incidence rate whereas Desoto has lowest death rate. (Map 2) With a pie chart clearly compare the incidence and death rates at the same time on a single map. As per (statistical graph 1) of death rate, the minimum value is 1, and the maximum value is 19.4 with mean as 4.9 representing a skewed graph. The incidence rate as per (statistical graph 2) shows a minimum of 3.5 and 86.2 as maximum with mean 18.3 again it is the skewed graph. The (Map 3 and Table 3) demonstrate the incidence rate compared to licensed dentist showing gradual symbols, bigger the symbol higher the number of dentist in that region. It shows Glades has lowest and Alachua has the highest number of the dentist. The (statistical graph 3) has shown a minimum of 7.8 and a maximum of 109.5 with the mean of 37.1 licensed dentists. Whereas as per the (Map 4 and Table 4) the symbol ‘H’ represent the access to dental care by low-income population showing gradual increase in size with more number of facility availability, showing Monroe having lowest and Liberty having highest access of dental care to low-income population whereas incidence is greater in both the places but death rate is slightly less in Liberty. As per (statistical graph 4) minimum is 12.7, the maximum is 60.1 and mean 30.5 of access to dental care by low-income population. (Map 5 and 6) demonstrate that there is high oral cancer incidence in Whites as compared to Blacks. (Map 7) shows the cancer hospitals location in Florida with buffered zone at 3, 7 and 11 miles as accessible area, and choropleth map representing death rate of oral cancer, as there is high death rate in area outside the buffer zone, as the hospitals are not in a approachable distance to patients.
Discussion
As per the maps, tables and graphs it shows that incidence rate of oral cancer has the great disparity in the range that is some places have the very high incidence as compared to others. There is more incidence and death rate in the north as compared to south of Florida. Similarly, most of the places do not have licensed dentist. There are a high number of incidences in area with less percentage of licensed dentists. There is less percentage of access to dental care to the low-income population in Florida. The cancer hospital location where not accessible resulting in high death rate in that area. The overall Union has highest incidence rate, highest death rate, with lowest number of licensed dentist and moderate access to dental care to the low-income population.
There is further scope to do research in this field, to better determine the correlation of these factors in detail. The age-adjusted data could be used showing more detail about population demonstrating the county level data that could be geocoded as per the affected population. The residential addresses of patients with oral cancer can be geocoded to have better understanding of effect of proximity to hospital by using spatial buffering technique. These limitations were due to unavailability of detail county level census data in the short period.
I learned to map the different factors related to oral cancer survival and treatment and to demonstrate the data that is available in non-spatial formats. It is more informative to demonstrate spatially and analyse the present situation with help of map rather than looking at big data sheets. This project has opened some new areas for research by comparing incidence with death rate and some other factors that might be contributing to incidence and death rate such as availability of dentist and access to these facilities to the low-income population. The project could be improved by getting the county level data and mapping more detailed study map. This could be the area of further research with detail data from census. Spatial epidemiology is useful in demonstrating and understanding the oral cancer incidence and comparing other factors related to it, in less time that could be time-consuming if shown in charts and data tables. Spatial epidemiology makes this analysing and comparing process easier for policymaker while taking a decision to improve the health care department.
Acknowledgements
I acknowledge the Florida Cancer Data System and Florida Department of Health, Division of Public Health Statistics & Performance Management for providing the access to their data.
References
- http://seer.cancer.gov/statfacts/html/oralcav.html
- http://www.cdc.gov/tobacco/data_statistics/state_data/state_highlights/2010/states/florida/
- Guo, Yi., McGorray, S. P., Riggs, C. E., & Logan, H. L. (2013). Racial disparity in oral and pharyngeal cancer in Florida in 1991-2008: Mixed trends in stage of diagnosis. Community dentistry and oral epidemiology, 41(2), 110-9.
- http://www.floridacharts.com/charts/OtherIndicators/NonVitalIndNoGrpDataViewer.aspx?cid=0444
- http://www.swfwmd.state.fl.us/data/gis/layer_library/category/cartographic.
- Tomar, S. L., Loree, M., Logan, H. (2004). Racial differences in oral and pharyngeal cancer treatment and survival in Florida. Cancer Causes & Control, 15(6), 601-9.
- http://fcds.med.miami.edu/inc/statistics.shtml
- https://www.google.com/maps/search/cancer+hospital+in+Florida/@27.7089381,-83.5126616,7z/data=!3m1!4b1
- http://viewer.nationalmap.gov/viewer/
Appendix
_______________________________________
Vidushi Prasad – Epidemiologist, Masters in Public Health (MPH) Texas A&M University Dental Surgeon (B.D.S.), DMIMS, India
Tags: Cancer, Public Health
This article originally appeared on Transcend Media Service (TMS) on 14 Jun 2021.
Anticopyright: Editorials and articles originated on TMS may be freely reprinted, disseminated, translated and used as background material, provided an acknowledgement and link to the source, TMS: Oral Cancer in Florida – World No Tobacco Day, is included. Thank you.
If you enjoyed this article, please donate to TMS to join the growing list of TMS Supporters.
![]()
This work is licensed under a CC BY-NC 4.0 License.