
The Climate Dice are Loaded. Now, a New Frontier?
ENVIRONMENT, 28 Aug 2023
James Hansen, Makiko Sato and Reto Ruedy | Columbia University - TRANSCEND Media Service
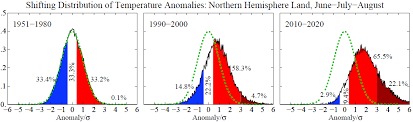
Fig. 1. The shifting bell curve for Northern Hemisphere land in the summer.
13 Jul 2023 – Andy Revkin recently asked whether the “climate dice” have become more “loaded” in the last 15 years. Climate dice were defined1 in 1988, after we realized that the next cool summer may cause the public to discount human-caused climate change. The answer is “yes,” the dice are more loaded as we will explain via the shifting bell curve (Fig. 1). The shift is large enough that most people notice the change, but that doesn’t prevent a person with a bias from taking the cool June in the U.S. this year (Fig. 2) as proof that global warming predictions were wrong – and, of course, a loose cannon on Twitter has done just that. That’s nonsense, of course. On global average, June 2023 was easily the warmest June in the historical record, as we will illustrate below.
What to do about loose cannons? Censor them? Bad idea. Censorship leads to enforced conformity, which has more serious consequences than loose cannons. Conformity leads to dogma,2 which is anti-science. Science aims to compile real-world data and interpret it without prejudice, including its implications for policy. In a democracy, we must keep the public informed, which requires correcting disinformation. The aim is not to persuade a loose cannon – who likely has prior bias and is unpersuadable – but rather to educate those people who are open-minded.
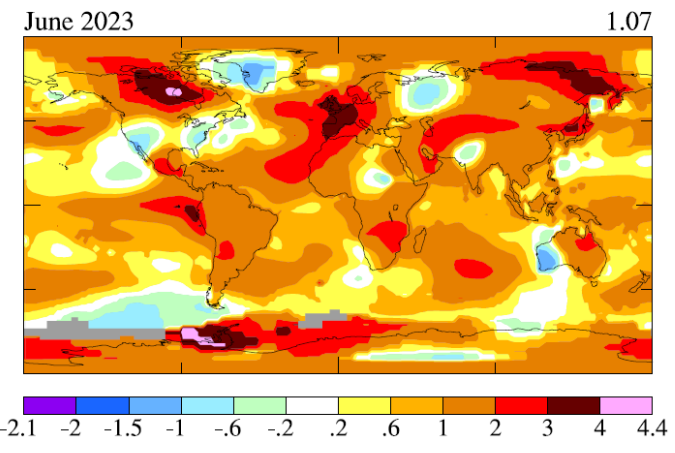
Fig. 2. Surface temperature anomaly (°C) in June 2023 relative to 1951-1980 June mean.
A 1-page description of the bell curves and climate dice is available as the author summary of our PNAS paper3 on the topic. The variability of summer mean temperature in the base period (1951- 1980, prior to the period of rapid global warming), is described by the bell curve on the left (Fig. 1). By definition, the one-third of summers closest to average temperature are the white, warmer summers are red and colder are blue, thus each color covering 2 of the 6 sides of the dice. By the last decade of the 20th century, red conditions were occurring 63% of the time on Northern Hemisphere land, which is almost the 67% needed to cover 4 sides. Twenty years later, the red area is 87.6%, five sides of the dice. So, the answer to Andy’s question is: yes, one more side is red.
The more important point is the dark red area on the bell curve, the portion that exceeds three standard deviations. These are extremely hot summers that seldom occurred in the base period (less than 1% of the time). Chance of occurrence now is more than 20%, thus covering more than one side of the dice (one side is 16.7%). Increase of such climate extremes has the greatest practical importance. Moreover, the moisture extremes are more important than the temperature extremes.
In testimony to Congress in 1988 and 1989, and in a paper attached to the 1989 testimony, we noted that global warming causes wet places to get wetter and dry places to get drier. In places where the average precipitation changes little, we showed that wet times get wetter and dry times get drier.
We also found that storms become stronger in a warmer world. We found that the “fuel” for storms, something called “moist static energy” – the sum of sensible heat, latent heat, and geopotential energy – increases in a warmer world. Moist static energy increases especially near the surface, so a warmer climate is prone to more powerful vertical convection that reaches greater altitude. In our climate model, doubled CO2 caused the height of convective cumulus storm cells to increase several hundred meters. Higher absolute humidity and deeper penetration of moist convection cause a larger portion of the rainfall to occur in intense thunderstorms, as opposed to the gentler rainfall from large-scale stratiform clouds. Increased storm strength is not limited to thunderstorms. Kerry Emanuel of MIT used sea surface temperature increases from our 2×CO2 experiment to estimate the effect on maximum intensity of tropical cyclones. Minimum sustained surface pressure fell from 880 mb to 800 mb and maximum potential wind speed increased from 175 to 220 miles per hour.
A new climate frontier? Suspicion that we are headed into new climate territory, not seen in the past million years,4 is fueled by the present extraordinarily large Earth’s energy imbalance (EEI). EEI (Fig. 3) is the proximate cause of global warming: as long as more energy is coming in than going out, we must expect global warming to continue. Given the acceleration of EEI in the past several years (Fig. 3), we anticipate an acceleration of global warming.
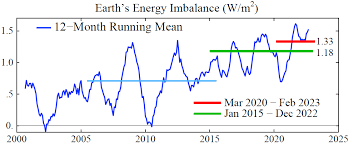
Fig. 3. 12-month running-mean of Earth’s energy imbalance from CERES satellite data5 normalized to 0.71 W/m2 mean for July 2005 – June 2015 (light blue bar) from in situ data.6
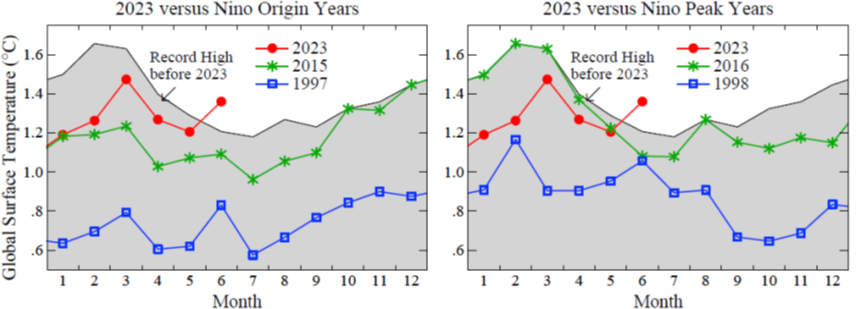
Fig. 4. Global temperature (relative to 1880-1920 mean) for the 1997-98 and 2015-16 super El Ninos with the budding 2023-24 El Nino. The two earlier El Ninos peaked in February of the second year. It is too early to tell how strong the current El Nino will be and whether it will peak in February 2024.
Acceleration is difficult to measure because of the large interannual variability of global temperature associated with tropical El Nino/La Nina oscillations. If the newborn El Nino proves to be comparable to the prior two strong El Ninos (1997-98 and 2015-16), the 2023-24 global temperature will provide a measuring stick that helps determine whether the global warming rate is accelerating.
In the 18 years between the 1997-98 and 2015-16 El Ninos, global temperature increased 0.43°C, thus at rate of 0.24°C per decade, larger than the 1970-2010 global warming rate (0.18°C/decade), as has been pointed out.7 For reasons discussed in the draft paper Global warming in the pipeline,8 we anticipate acceleration of global warming to the rate shown by the yellow area in Fig. 5. In that case, the 2023-24 temperature curve (red curve in Fig. 4) is likely to fall substantially above the (green) curve for the prior El Nino and may set new global temperature records continually during the next 12 months. It seems that we are headed into a new frontier of global climate.
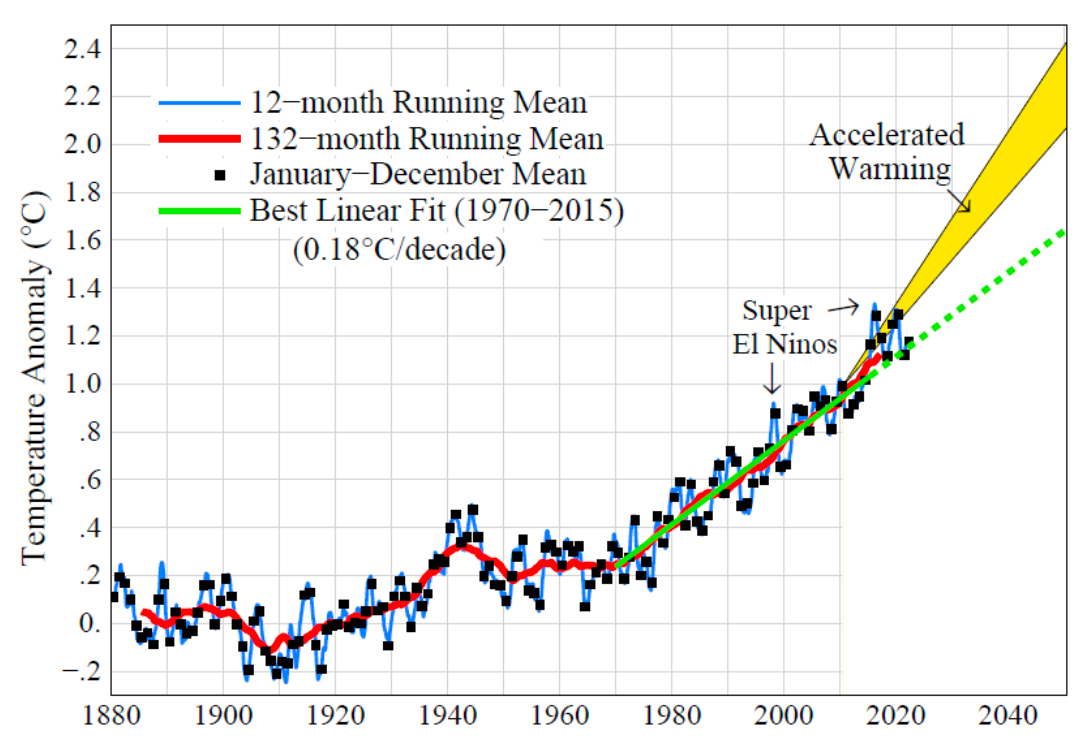
Fig. 5. Global temperature relative to 1880-1920. Edges of the predicted post-2010 accelerated warming rate (see text) are 0.36 and 0.27°C per decade.
NOTES:
1 Hansen, J., I. Fung, A. Lacis, D. Rind, S. Lebedeff, R. Ruedy, G. Russell, and P. Stone: Global climate changes as forecast by Goddard Institute for Space Studies three-dimensional model. J. Geophys. Res., 93, 9341-9364, 1988.
2 For example, belief that we can still solve the climate problem via just greater reduction of greenhouse gas emissions. Or belief that borrowing enough money from our grandchildren to build solar panels and windmills as fast as possible will significantly reduce global CO2 emissions. Or that support for nuclear power is “not needed” because solar power is so cheap (Nuclear power is a needed carbon-free complement to renewables and viable scenarios for decarbonized electricity include an increasing role for modern nuclear power, but there is a total disconnect with financing (Bowen, M and K. Guanio, 2023: A critical disconnect: Relying on nuclear energy in decarbonization models while excluding it from climate finance taxonomies, Commentary, Center on Global Energy Policy at Columbia University.).
3 Hansen J, Sato M and Ruedy R 2012 Perception of climate change Proc Natl Acad Sci 109 14726-14727 E2415
4 Global warming of 1.2°C since 1880-1920 has brought global temperature to at least the level of the prior interglacial period, the Eemian, about 120,000 years ago. The Eemian was one of the warmest interglacials in the last million years.
5 Loeb, N. G., Johnson, G. C., Thorsen, T. J., Lyman, J. M., Rose, F. G., & Kato, S., Satellite and ocean data reveal marked increase in Earth’s heating rate, Geophys. Res. Lett. 48, e2021GL093047, 2021.
6 von Schuckmann K, Cheng L, Palmer MD et al. Heat stored in the Earth system: where does the energy go?, Earth System Science Data 2020;12:2013-41
7 Grantham, J., The Race of Our Lives Revisited, GMO White Paper, August 2018.
8 Global warming in the pipeline, draft paper, criticisms welcome
Download PDF file:
Climate Dice 13 July 2023 – columbia.edu
Tags: Climate Change, Earth’s Energy Imbalance-EEI, Ecology, Energy, Environment, Global warming
This article originally appeared on Transcend Media Service (TMS) on 28 Aug 2023.
Anticopyright: Editorials and articles originated on TMS may be freely reprinted, disseminated, translated and used as background material, provided an acknowledgement and link to the source, TMS: The Climate Dice are Loaded. Now, a New Frontier?, is included. Thank you.
If you enjoyed this article, please donate to TMS to join the growing list of TMS Supporters.
![]()
This work is licensed under a CC BY-NC 4.0 License.